

Question: (Financial Information below) We will focus on Amazon's trading multiples and compare them to that of peers. The latest available number of shares outstanding for
(Financial Information below) We will focus on Amazon's trading multiples and compare them to that of peers.
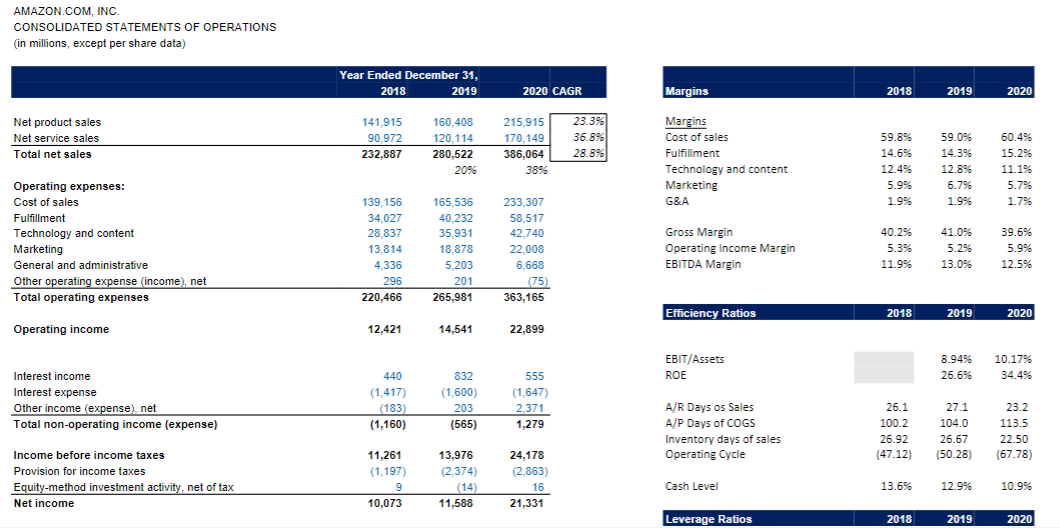
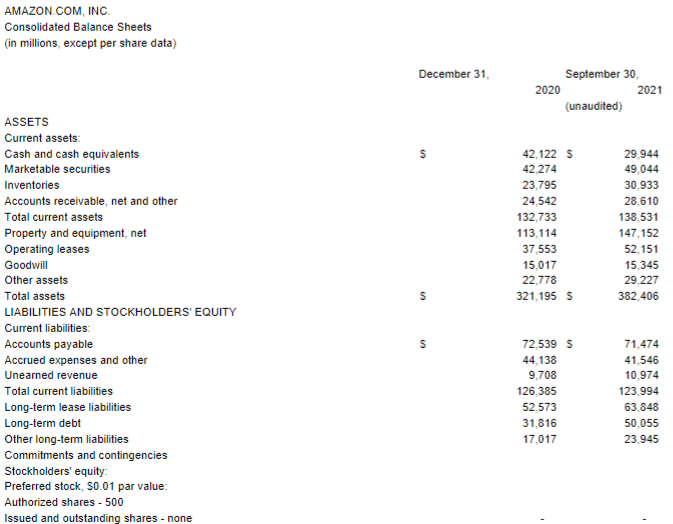
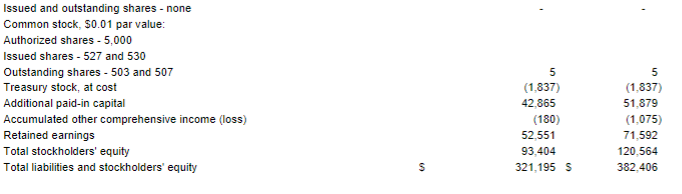
The latest available number of shares outstanding for Amazon is. 506,440,520 For this exercise, please use Amazon's closing share price as of 10/28/2021: $3446.57
Part 1:
1. Based on the above assumptions, calculate market value of equity.
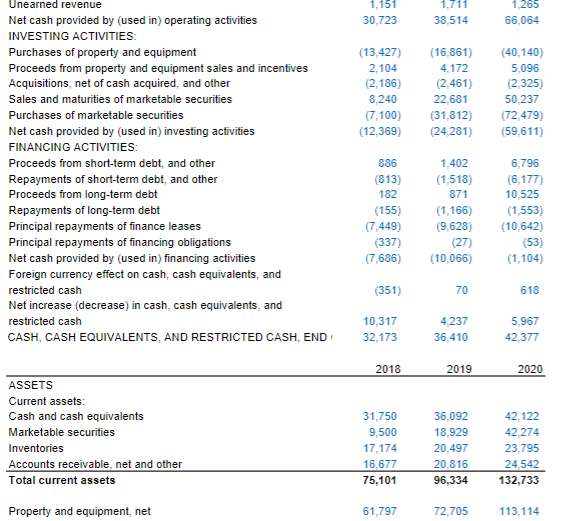
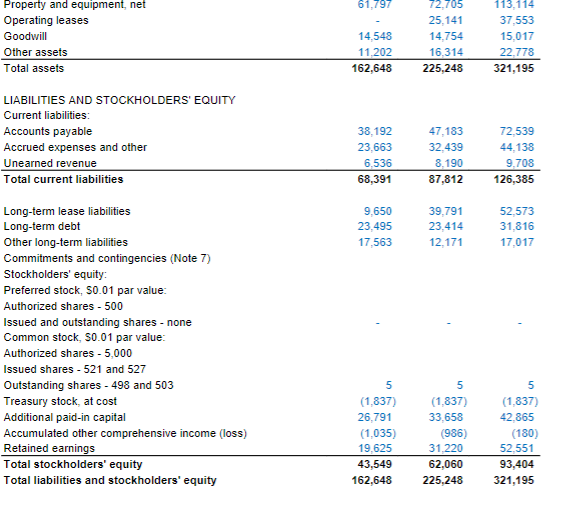
2, Based on the most recent balance sheet, calculate enterprise value for Amazon. For this exercise, ignore marketable securities and lease liabilities.
Part 2:
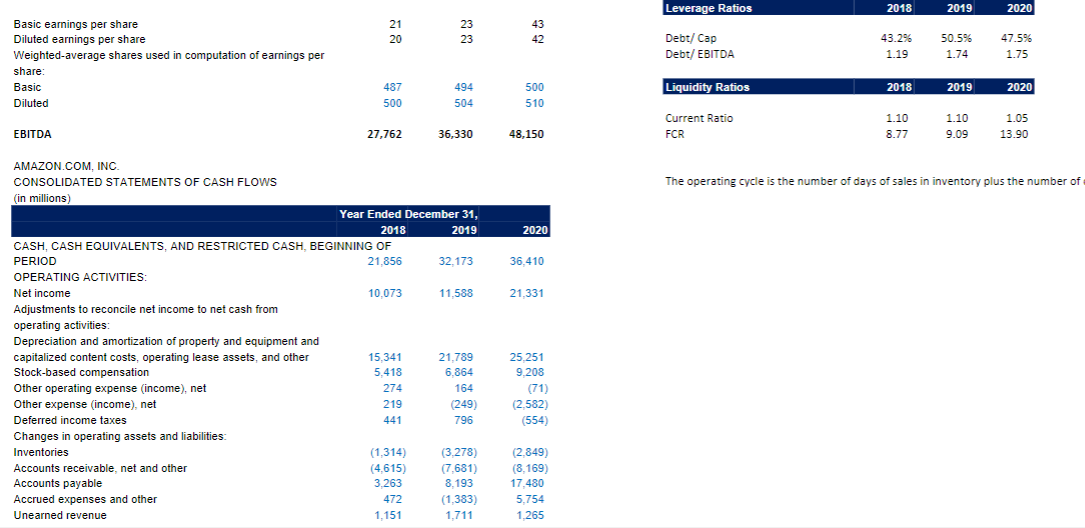
Based on the financial statements provided in this spreadsheet, calculate: 1. LTM Revenues 2. LTM EBITDA 3. LTM EBIT 4. LTM Net Income
Part 3:
Based on Parts 1 and 3, calculate: 1. EV /LTM Revenues 2. EV / LTM EBITDA 3. EV / LTM EBIT 4. Equity / LTM Net Income (equivalent or close to P/E) 5. Based on publicly available information, calculate dividend yield for Amazon stock
Part 4:
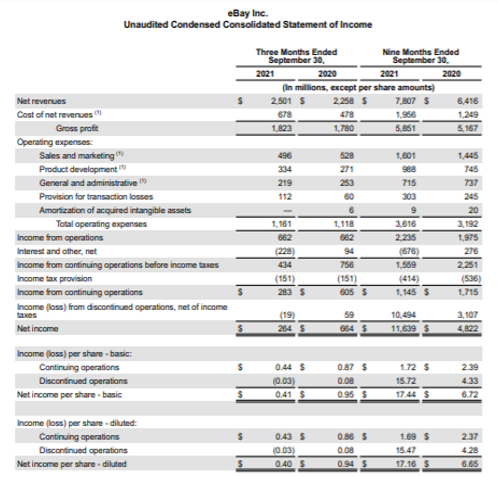
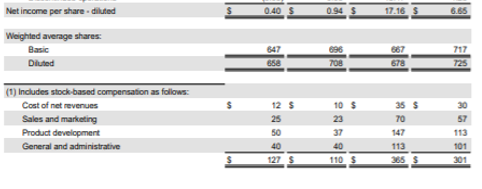
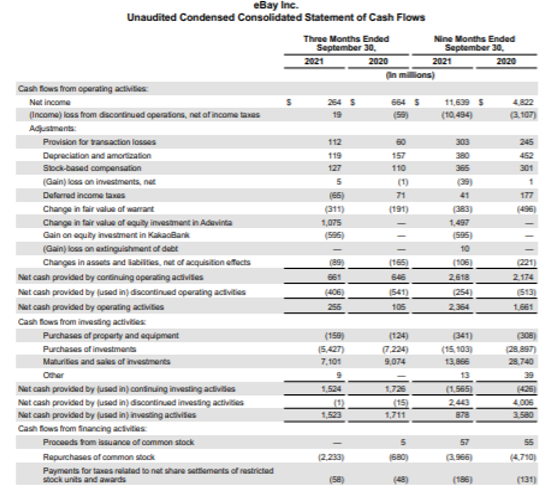
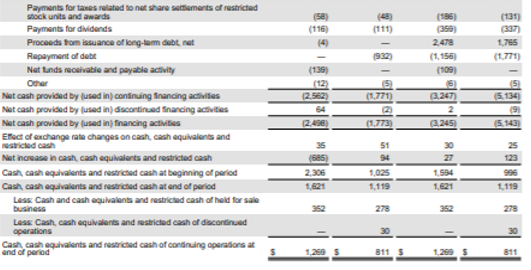
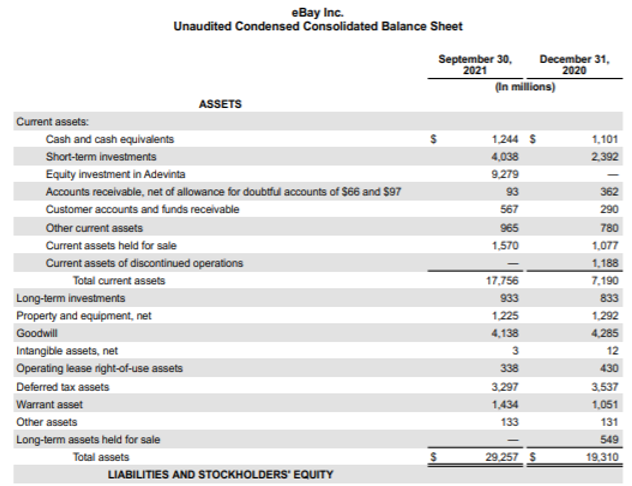
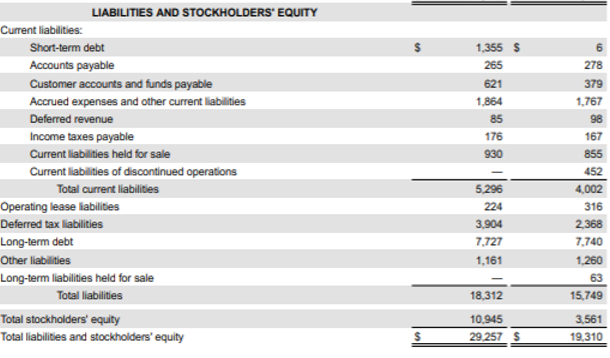
You would like to compare Amazon's trading levels to one of its competitors, Ebay:
| Name | Latest Reporting Date | Latest K Date | Shares Outstanding | 2020 Annual Revenues | 2020 Annual Operating Income | 2020 Annual Net Income | 2020 Annual D&A |
| Ebay | 9/20/2021 | 12/31/2020 | 650,055,805 | 10,271 | 2,711 | 2,542 | 609 |
Using closing share price as of 10/28/2021, calculate: 1. EV / LTM EBITDA and 2. Equity Value / LTM net income for Ebay Note: please include income from continuing operations only for your net income figure.
Part 5
1. Based on your calculations in Part 3 and Part 4, which stock, Amazon or Ebay is more expensive? How can you tell?
2. What can explain this difference?
Part 6:
1. Calculate forward-looking multiplesof net income from continuing operations for Amazon and Ebay for 2022-2026 based on equity research reports (use current / most recent market equity value) 2. Which conclusion for 5.2 does this calculation support? In which year does it become apparent?
3. How do your answers to questions 1 and 2 inform your understanding of Amazon's dividend yield?
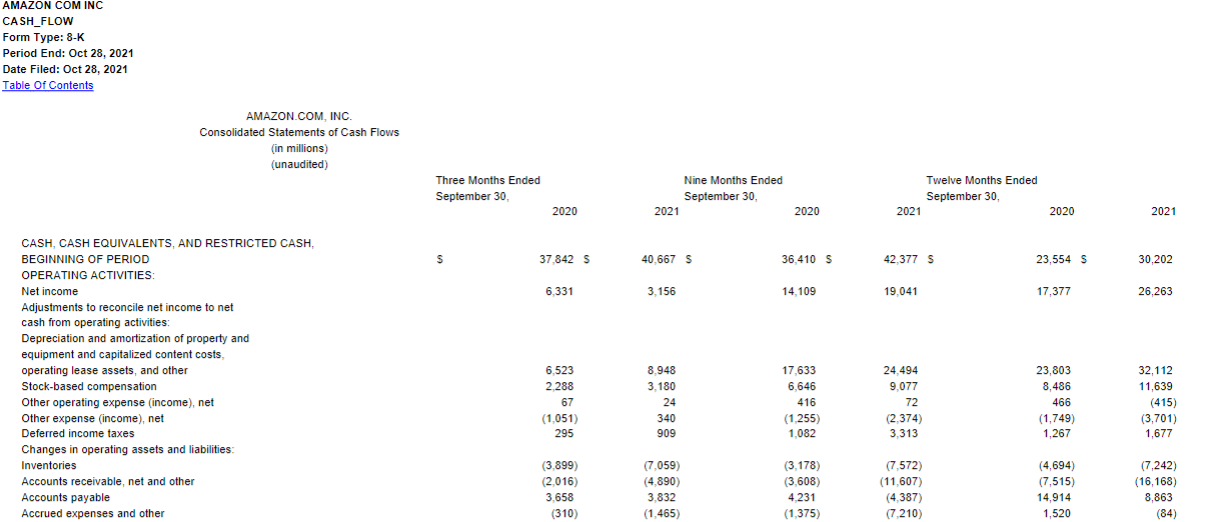
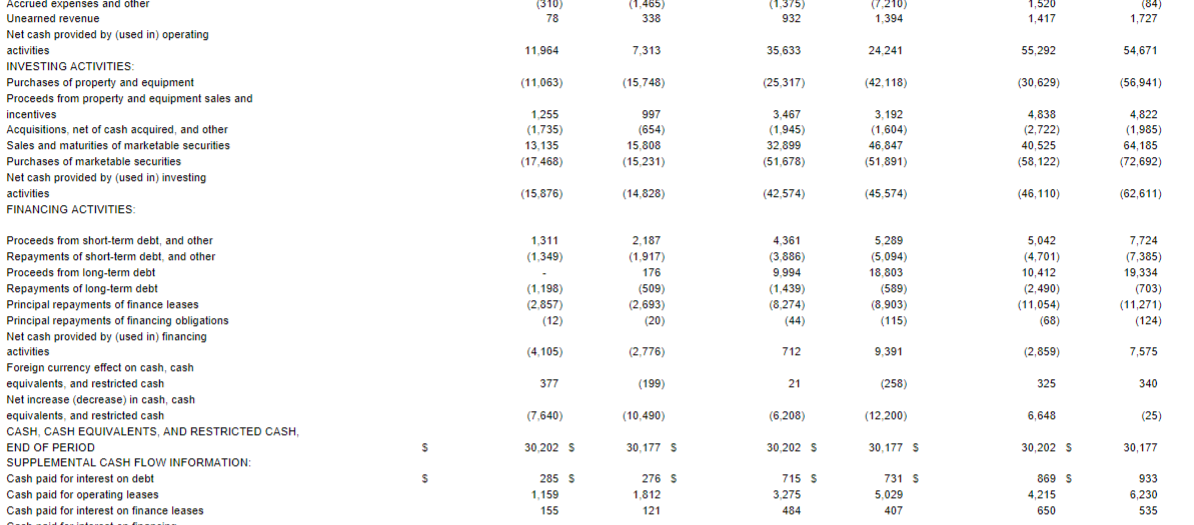
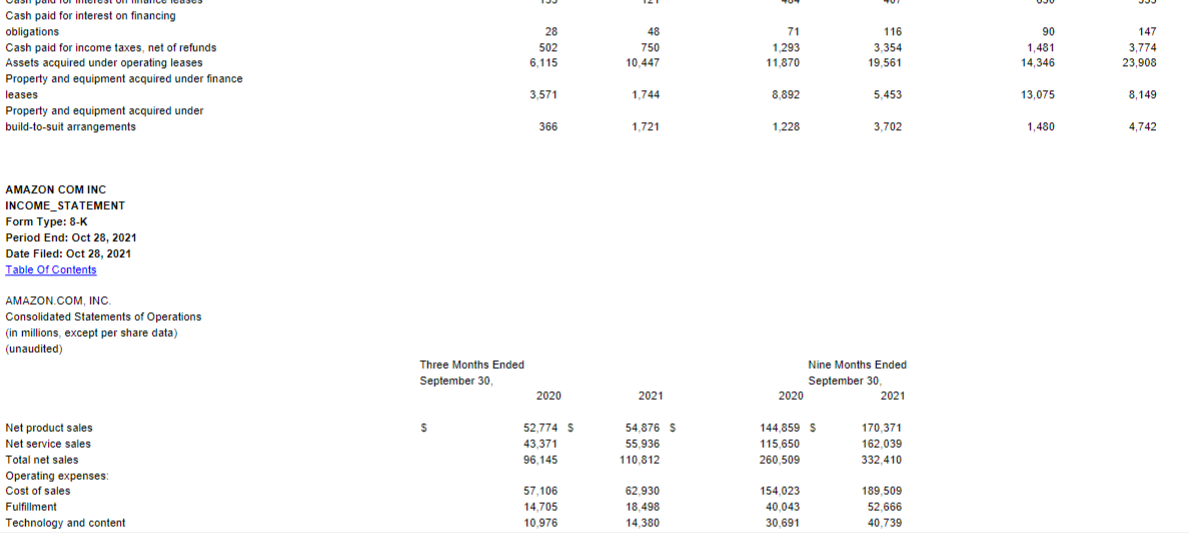
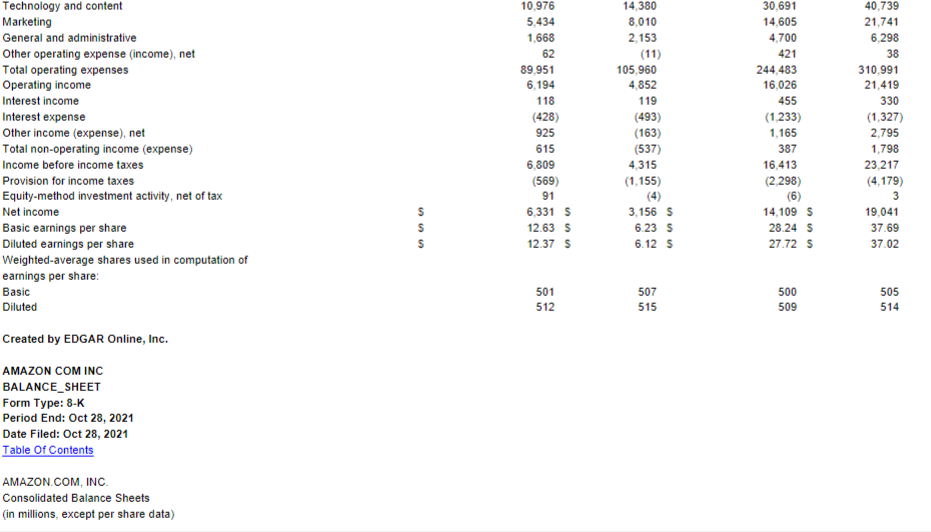
AMAZON.COM, INC. CONSOLIDATED STATEMENTS OF OPERATIONS (in millions, except per share data) Year Ended December 31, 2018 2019 2020 CAGR Margins 2018 2019 2020 160,408 215.915 Net product sales Net service sales Total net sales 141,915 90.972 232,887 23.395 36.8951 120.114 170.149 386,064 28.89 280,522 20% Margins Cost of sales Fulfillment Technology and content Marketing G&A 38% 59.8% 14.6% 12.4% 5.9% 1.9% 59.0% 14.3% 12.8% 6.7% 1.9% 60.4% 15.2% 11.196 5.7% 1.7% 233, 307 Operating expenses: Cost of sales Fulfillment Technology and content Marketing General and administrative Other operating expense (income), net Total operating expenses 139, 156 34.027 28.837 13.814 4,336 296 220,466 165,536 40.232 35,931 18,878 5.203 201 265.981 58,517 42.740 22.008 Gross Margin Operating Income Margin EBITDA Margin 40.295 5.3% 11.9% 41.0% 5.296 13.09 39.6% 5.9% 12.5% 6.668 (75) 363,165 Efficiency Ratios 2018 2019 2020 Operating income 12,421 14,541 22.899 EBIT/Assets ROE 8.9496 26.6% 10.17% 34.4% Interest income Interest expense Other income (expense), net Total non-operating income (expense) 440 (1,417) (183) (1,160) 832 (1,600) 203 (565) 555 (1.647) 2.371 1,279 A/R Days os Sales A/P Days of COGS Inventory days of sales Operating Cycle 26.1 100.2 26.92 (47.12) 27.1 104.0 26.67 (50.28) 23.2 113.5 22.50 (67.78) Income before income taxes Provision for income taxes Equity-method investment activity, net of tax Net income 11,261 (1,197) 9 10,073 13,976 (2.374) (14) 11,588 24,178 (2.863) 16 21,331 Cash Level 13.696 12.9% 10.9% Leverage Ratios 2018 2019 2020 Leverage Ratios 2018 2019 2020 21 20 23 23 43 42 Debt/ Cap Debt/ EBITDA 43.296 1.19 50.5% 1.74 47.5% 1.75 Basic earnings per share Diluted earnings per share Weighted-average shares used in computation of earnings per share: Basic Diluted 2018 2019 487 500 Liquidity Ratios 2020 494 504 500 510 Current Ratio FOR 1.10 8.77 1.10 9.09 1.05 13.90 EBITDA 48,150 27,762 36,330 The operating cycle is the number of days of sales in inventory plus the number of 2020 36,410 21,331 AMAZON.COM, INC. CONSOLIDATED STATEMENTS OF CASH FLOWS (in millions) ( Year Ended December 31, 2018 2019 CASH, CASH EQUIVALENTS, AND RESTRICTED CASH, BEGINNING OF PERIOD 21,856 32.173 OPERATING ACTIVITIES: Net income 10.073 11,588 nuusunen Adjustments to reconcile net income to net cash from operating activities: ser Depreciation and amortization of property and equipment and capitalized content costs, operating lease assets, and other 15,341 21.789 Stock-based compensation 5,418 6.864 Other operating expense (income), net 274 164 Other expense (income), net 219 (249) Deferred income taxes 441 796 Changes in operating assets and liabilities: Inventories (1,314) (3,278) Accounts receivable, net and other (4.615) (7,681) Accounts payable 3.263 8,193 Accrued expenses and other 472 Unearned revenue 1.151 1,711 25.251 9,208 (71) (2.582 (554) (2.849) (8.169) 17.480 5,754 1.265 (1,383) 1.151 30,723 1.711 38,514 1.265 66,064 (13.427) 2,104 (2.186) 8,240 (7.100) (12,369) (16,861) 4.172 (2.461) 22.681 (31,812) (24.281) (40,140) 5,096 (2.325) 50,237 (72.479) (59,611) Unearned revenue Net cash provided by (used in) operating activities INVESTING ACTIVITIES Purchases of property and equipment Proceeds from property and equipment sales and incentives Acquisitions, net of cash acquired, and other Sales and maturities of marketable securities Purchases of marketable securities Net cash provided by used in) investing activities FINANCING ACTIVITIES: Proceeds from short-term debt, and other Repayments of short-term debt, and other Proceeds from long-term debt Repayments of long-term debt Principal repayments of finance leases Principal repayments of financing obligations Net cash provided by (used in) financing activities Foreign currency effect on cash, cash equivalents, and restricted cash Net increase (decrease) in cash, cash equivalents, and restricted cash CASH, CASH EQUIVALENTS, AND RESTRICTED CASH, END 886 (813) 182 (155) (7,449) (337) (7.686) 1,402 (1,518) 871 (1,166) (9,628) (27) (10,066) 6.796 (6,177) 10.525 (1,553) (10.642) (53) (1,104) (351) 70 618 10,317 32.173 4.237 36.410 5.967 42.377 2018 2019 2020 ASSETS Current assets: Cash and cash equivalents Marketable securities Inventories Accounts receivable, net and other Total current assets 31.750 9,500 17.174 16,677 75,101 36,092 18,929 20,497 20.816 96,334 42,122 42.274 23,795 24,542 132,733 Property and equipment, net 61.797 72.705 113, 114 61,797 Property and equipment, net Operating leases Goodwill Other assets Total assets 14,548 11.202 162,648 72.705 25.141 14,754 16,314 225.248 113,114 37,553 15.017 22.778 321,195 LIABILITIES AND STOCKHOLDERS' EQUITY Current liabilities: Accounts payable Accrued expenses and other Unearned revenue Total current liabilities 38.192 23.663 6.536 68,391 47.183 32.439 8,190 87,812 72.539 44,138 9.708 126,385 9,650 23,495 17,563 39.791 23.414 12,171 52.573 31.816 17,017 Long-term lease liabilities Long-term debt Other long-term liabilities Commitments and contingencies (Note 7) Stockholders' equity Preferred stock, 50.01 par value: Authorized shares - 500 Issued and outstanding shares - none Common stock, 50.01 par value: Authorized shares - 5,000 Issued shares - 521 and 527 Outstanding shares - 498 and 503 Treasury stock, at cost Additional paid-in capital Accumulated other comprehensive income (loss) Retained earnings Total stockholders' equity Total liabilities and stockholders' equity 5 (1,837) 26,791 (1,035) 19,625 43,549 162,648 5 (1,837) 33,658 (986) 31.220 62,060 225.248 5 (1.837) 42.865 (180) 52.551 93,404 321,195 AMAZON COM INC CASH_FLOW Form Type: 8-K Period End: Oct 28, 2021 Date Filed: Oct 28, 2021 Table of Contents AMAZON.COM, INC. Consolidated Statements of Cash Flows (in millions) ( (unaudited) ) Three Months Ended September 30, Nine Months Ended September 30, Twelve Months Ended September 30, 2020 2021 2020 2021 2020 2021 S S 37.842 s 40.667 S 36.410 S 42.377 S 23,554 5 30,202 6,331 3.156 14,109 19.041 17,377 26,263 CASH, CASH EQUIVALENTS, AND RESTRICTED CASH, BEGINNING OF PERIOD OPERATING ACTIVITIES: Net income Adjustments to reconcile net income to net cash from operating activities: Depreciation and amortization of property and equipment and capitalized content costs operating lease assets, and other , stock based Stock-based compensation Other operating expense (income), net Other expense (income), net Deferred income taxes Changes in operating assets and liabilities: Inventories Accounts receivable, net and other Accounts payable Accrued expenses and other 6.523 2.288 67 (1,051) ) 295 8.948 3.180 24 340 909 17,633 6,646 416 (1.255) 1,082 24.494 9,077 72 (2.374) 23,803 8,486 466 (1,749) 1,267 32,112 11,639 (415) (3,701) 1,677 3.313 (3.899) (2016) 3.658 (310) (7,059) (4.890) 3.832 (1,465) (3,178) (3,608) 4231 (1.375) (7.572) (11,607) (4,387) (7.210) (4,694) (7,515) 14,914 1,520 (7.242) (16,168) 8,863 (84) (310) 78 (1.465) 338 (1,375) 932 (7.210) 1.394 1,520 1,417 (84) 1,727 11.964 7,313 35,633 24.241 55,292 54,671 (11,063) ( (15,748) (25,317) (42.118) (30,629) (56,941) Accrued expenses and other Unearned revenue Net cash provided by (used in) operating activities INVESTING ACTIVITIES: Purchases of property and equipment Proceeds from property and equipment sales and incentives Acquisitions, net of cash acquired, and other Sales and maturities of marketable securities Purchases of marketable securities Net cash provided by (used in) investing activities FINANCING ACTIVITIES 1.255 (1.735) 13.135 (17,468) ) 997 (654) 15,808 (15.231) 3,467 (1.945) 32,899 (51,678) 3.192 (1.604) 46.847 (51,891) 4,838 (2,722) 40,525 (58,122) 4,822 (1,985) 64,185 (72,692) (15,876) (14,828) (42,574) (45,574) (46,110) ) (62,611) 1,311 (1.349) 2.187 (1.917) 176 (509) (2.693) (20) 4.361 (3,886) 9.994 (1.439) (8,274) 7,724 (7,385) 19,334 5,289 (5,094) 18,803 (589) (8,903) (115) 5,042 (4.701) 10,412 (2,490) (11,054) (68) (1.198) (2,857) (12) () (703) (11,271) (124) (4.105) (2.776) 712 9.391 (2,859) 7,575 Proceeds from short-term debt, and other Repayments of short-term debt, and other Proceeds from long-term debt Repayments of long-term debt Principal repayments of finance leases Principal repayments of financing obligations Net cash provided by (used in) financing activities Foreign currency effect on cash, cash equivalents, and restricted cash Net increase (decrease) in cash, cash equivalents, and restricted cash CASH, CASH EQUIVALENTS, AND RESTRICTED CASH, END OF PERIOD END SUPPLEMENTAL CASH FLOW INFORMATION: Cash paid for interest on debt Cash paid for operating leases Cash paid for interest on finance leases 377 (199) 21 (258) 325 340 (7.640) (10,490) (6,208) ) (12,200) 6,648 (25) $ 30,202 s 30.177 $ 30,202 $ 30,177 $ 30,202 S 30,177 $ 285 S 1.159 155 276 5 1.812 121 715 5 3,275 484 731 $ 5,029 407 869 $ 4,215 650 933 6,230 535 28 502 6.115 48 750 10.447 71 1293 11.870 116 3.354 19.561 90 1,481 14,346 147 3,774 23,908 Cash paid for interest on financing obligations Cash paid for income taxes, net of refunds Assets acquired under operating leases Property and equipment acquired under finance leases Property and equipment acquired under build-to-suit arrangements 3,571 1.744 8.892 5.453 13,075 8.149 366 1.721 1.228 3.702 1,480 4,742 AMAZON COM INC INCOME STATEMENT Form Type: 8-K Period End: Oct 28, 2021 Date Filed: Oct 28, 2021 Table of Contents AMAZON.COM, INC Consolidated Statements of Operations (in millions, except per share data) (unaudited) Three Months Ended September 30, Nine Months Ended September 30, 2021 2020 2021 2020 $ 52.774 S 43,371 96,145 54.876 S 55,936 110,812 144,859 $ 115,650 260,509 170.371 162,039 332,410 Net product sales Net service sales Total net sales Operating expenses Cost of sales Fulfillment Technology and content 57,106 14.705 10.976 62.930 18.498 14.380 154 023 40 043 30.691 189,509 52.666 40.739 10.976 5,434 1,668 62 89,951 6,194 118 Technology and content Marketing General and administrative Other operating expense (income), net Total operating expenses Operating income Interest income Interest expense Other income (expense), net Total non-operating income (expense) Income before income taxes Provision for income taxes Equity-method investment activity, net of tax Net income Basic earnings per share Diluted earnings per share Weighted average shares used in computation of earnings per share: Basic Diluted 14,380 8,010 2.153 (11) 105,960 4.852 119 (493) (163) (537) 4.315 (1,155) (428) 925 615 6,809 (569) 91 6,331 5 12.63 $ 12.37 s 30,691 14,605 4.700 421 244,483 16,026 455 (1.233) 1,165 387 16,413 (2,298) (6) 14,109 28.24 $ 27.72 5 40.739 21.741 6.298 38 310.991 21.419 330 (1,327) 2.795 1,798 23.217 (4,179) 3 19.041 37.69 37.02 3,156 6.23 6.12 s 501 507 500 512 505 514 515 509 Created by EDGAR Online, Inc. AMAZON COM INC BALANCE_SHEET Form Type: 8-K Period End: Oct 28, 2021 Date Filed: Oct 28, 2021 Table of Contents AMAZON.COM, INC Consolidated Balance Sheets (in millions, except per share data) AMAZON.COM, INC. Consolidated Balance Sheets (in Millions, except per share data) December 31, September 30, 2020 2021 (unaudited) 42,122 5 42.274 23,795 24,542 132.733 113,114 37,553 15,017 22,778 321, 1955 29,944 49,044 30,933 28.610 138,531 147,152 52,151 15.345 29.227 382,406 S ASSETS Current assets: Cash and cash equivalents Marketable securities Inventories Accounts receivable, net and other Total current assets Property and equipment, net Operating leases Goodwill Other assets Total assets LIABILITIES AND STOCKHOLDERS' EQUITY Current liabilities: Accounts payable Accrued expenses and other Unearned revenue Total current liabilities Long-term lease liabilities Long-term debt Other long-term liabilities Commitments and contingencies Stockholders' equity Preferred stock, 30.01 par value: Authorized shares - 500 Issued and outstanding shares - none $ 72,539 $ 44,138 9,708 126,385 52,573 31,816 17,017 71,474 41,546 10,974 123,994 63,848 50.055 23.945 Issued and outstanding shares - none Common stock, 50.01 par value: Authorized shares - 5,000 Issued shares - 527 and 530 Outstanding shares - 503 and 507 Treasury stock, at cost Additional paid-in capital Accumulated other comprehensive income (loss) Retained earnings Total stockholders' equity Total liabilities and stockholders' equity 5 (1.837) 42.865 (180) 52.551 93,404 321,195 $ 5 (1,837) 51,879 (1,075) 71.592 120,564 382 406 s eBay Inc. Unaudited Condensed Consolidated Statement of Income Three Months Ended Nine Months Ended September 30, September 30, 2021 2020 2021 2020 (in millions, except per share amounts) 2501 $ 2.258 $ 7,807 $ 678 478 1.966 1.249 1.823 1.780 5.851 5.167 $ 6.416 496 334 219 112 Net revenues Cost of net revenues Gross profit Operating expenses Sales and marketing Product development General and administrative Provision for transaction losses Amortization of acquired intangible assets Total operating expenses Income from operations Interest and other net Income from continuing operations before income taxes Income tax provision Income from continuing operations Income (loss) from discontinued operations, net of income taxes Net income 528 271 253 60 6 1.118 1.601 ses 715 303 9 3,616 2.235 (676) 1.569 (414) 1.145 $ 1445 745 737 245 20 2.192 1.975 1,161 882 (228) 434 (151) 283 $ 278 94 756 (151) 805 $ 2.251 (536) 1,715 $ (19) 264 $ 59 664 $ 10.494 11.639 $ 3.107 4,822 2.39 Income (los) per share-basic: Continuing operations Discontinued operations Niet income per share basic 0.44 $ (0.03) 0.41 $ 0.87 $ 0.08 0.95 $ 1.72 15.72 17.44 6.72 $ Income (los) per share-diluted: Continuing operations Discontinued operations Net income per share. diluted 0.43 $ 10.03) 0.40 $ 0.88 $ 0.08 0.94 $ 1.69 $ 15.47 17.16 $ 2.37 4.28 6.65 0.40 $ 0.94 $ 17.16 $ 6.65 847 65 717 725 708 678 Net income per share - diluted Weighted average shares: Basic Diluted (1) Includes stock based compensation as follows: Cost of net revenues Sales and marketing Product development General and administrative 12 $ 25 50 40 127 $ 10$ 23 37 40 110 $ 35 $ 70 147 113 365 $ 113 101 301 $ 119 110 301 1 71 eBay Inc. Unaudited Condensed Consolidated Statement of Cash Flows Three Months Ended Nine Months Ended September 30, September 30. 2021 2020 2021 2020 in millions) Cash flows from operating activities Net income 254 5 6545 11.639 5 4822 Income) loss from discontinued operations, net of income taxes 19 (59 (10,4947 (3.107) AGustments: Provision for transaction losses 112 60 245 Depreciation and amortization 157 452 Stock-based compensation 127 (Gain) loss an investments, net 5 (1) Deferred income taxes (65) 177 Change in fair value of warrant (311) (191) (496 Change in fair value of equity investment in Adevinta 1,075 Gain on equity investment in Kakao@ank (586) (Gain los an extinguishment of debt Changes in assets and abilities, net of acquisition effects (89) (185) (221) Net cash provided by continuing operating activites 545 Niet cash provided by used in discontinued operating activities (406) 541) 5131 Net cash provided by operating activities 256 105 1661 Cash flows from investing activities Purchases of property and equipment (159) (124) (341) (308 Purchases of investments 15.427) (7.224 (15.1031 (28 897) Maturities and sales of investments 7,101 9,074 29 740 Other Net cash provided by used in continuing investing activities 1,524 1,725 (1.565 Net cash provided by used in) discontinued investing activities 0 (15) 4006 Net cash provided by used in investing activities 1,523 1,711 3.580 Cash flows from financing actvities: Proceeds from issuance of common stock Repurchases of common stock (2.230) 580) (3.966 (4.710) Payments forts related to not share settlements of restricted stock units and awards (Se (196) (131) 661 2174 % @ $ | #| | |3| 5 55 (58) (116) (111) (185) (359) 2478 (1.156) (109) 6 (3.2471 (131) (337) 1.765 (1.771) 1932) (139) 15 (1.771) 15.134 (2.562) 64 (2.490 (1.773 (3.245 (5.143) Payments forts related to net share settlements of restricted stock units and awards Payments for dividends Proceeds tom issuance of long-term debt, net Repayment of date Net funds receivable and payable activity Other Net cash provided by used in continuing financing activities Net cash provided by used in) discontinued financing activities Niet cash provided by used in financing activities Effect of exchange rate changes on cash cash equivalents and restricted cash Net increase in cash, cash equivalents and restricted cash Cash, cash equivalents and restricted cash at beginning of period Cash, cash equivalents and restricted cash at end of period Less Cash and cash equivalents and restricted cash of held for sale Less Cash, cash equivalents and restricted cash of discontinued Cash cash equivalents and restricted cash of continuing operations at end of period 51 94 25 123 (685) 2,306 1,621 30 27 1.594 1.621 1,119 1.119 352 278 278 30 $ 1.269 $ 811 5 811 eBay Inc. Unaudited Condensed Consolidated Balance Sheet September 30, December 31, 2021 2020 (In millions) 1,101 2.392 1.244 S 4,038 9.279 93 567 965 1.570 ASSETS Current assets: Cash and cash equivalents Short-term investments Equity investment in Adevinta Accounts receivable, net of allowance for doubtful accounts of $66 and $97 Customer accounts and funds receivable Other current assets Current assets held for sale Current assets of discontinued operations Total current assets Long-term investments Property and equipment, net Goodwill Intangible assets, net Operating lease right-of-use assets Deferred tax assets Warrant asset Other assets Long-term assets held for sale Total assets LIABILITIES AND STOCKHOLDERS' EQUITY 17.756 933 1.225 4.138 3 338 3.297 1.434 133 362 290 780 1,077 1,188 7.190 833 1.292 4,285 12 430 3.537 1,051 131 549 19,310 $ 29,257 S 278 1,355 $ 265 621 1.864 85 176 930 LIABILITIES AND STOCKHOLDERS' EQUITY Current liabilities: Short-term debt Accounts payable Customer accounts and funds payable Accrued expenses and other current liabilities Deferred revenue Income taxes payable Current liabilities held for sale Current liabilities of discontinued operations Total current liabilities Operating lease labilities Deferred tax liabilities Long-term debt Other liabilities Long-term liabilities held for sale Total liabilities Total stockholders' equity Total liabilities and stockholders' equity 5.296 224 3,904 7.727 1,161 379 1,767 98 167 855 452 4,002 316 2.368 7,740 1.260 63 15.749 18,312 10.945 29.257 S 3.561 19,310 $ AMAZON.COM, INC. CONSOLIDATED STATEMENTS OF OPERATIONS (in millions, except per share data) Year Ended December 31, 2018 2019 2020 CAGR Margins 2018 2019 2020 160,408 215.915 Net product sales Net service sales Total net sales 141,915 90.972 232,887 23.395 36.8951 120.114 170.149 386,064 28.89 280,522 20% Margins Cost of sales Fulfillment Technology and content Marketing G&A 38% 59.8% 14.6% 12.4% 5.9% 1.9% 59.0% 14.3% 12.8% 6.7% 1.9% 60.4% 15.2% 11.196 5.7% 1.7% 233, 307 Operating expenses: Cost of sales Fulfillment Technology and content Marketing General and administrative Other operating expense (income), net Total operating expenses 139, 156 34.027 28.837 13.814 4,336 296 220,466 165,536 40.232 35,931 18,878 5.203 201 265.981 58,517 42.740 22.008 Gross Margin Operating Income Margin EBITDA Margin 40.295 5.3% 11.9% 41.0% 5.296 13.09 39.6% 5.9% 12.5% 6.668 (75) 363,165 Efficiency Ratios 2018 2019 2020 Operating income 12,421 14,541 22.899 EBIT/Assets ROE 8.9496 26.6% 10.17% 34.4% Interest income Interest expense Other income (expense), net Total non-operating income (expense) 440 (1,417) (183) (1,160) 832 (1,600) 203 (565) 555 (1.647) 2.371 1,279 A/R Days os Sales A/P Days of COGS Inventory days of sales Operating Cycle 26.1 100.2 26.92 (47.12) 27.1 104.0 26.67 (50.28) 23.2 113.5 22.50 (67.78) Income before income taxes Provision for income taxes Equity-method investment activity, net of tax Net income 11,261 (1,197) 9 10,073 13,976 (2.374) (14) 11,588 24,178 (2.863) 16 21,331 Cash Level 13.696 12.9% 10.9% Leverage Ratios 2018 2019 2020 Leverage Ratios 2018 2019 2020 21 20 23 23 43 42 Debt/ Cap Debt/ EBITDA 43.296 1.19 50.5% 1.74 47.5% 1.75 Basic earnings per share Diluted earnings per share Weighted-average shares used in computation of earnings per share: Basic Diluted 2018 2019 487 500 Liquidity Ratios 2020 494 504 500 510 Current Ratio FOR 1.10 8.77 1.10 9.09 1.05 13.90 EBITDA 48,150 27,762 36,330 The operating cycle is the number of days of sales in inventory plus the number of 2020 36,410 21,331 AMAZON.COM, INC. CONSOLIDATED STATEMENTS OF CASH FLOWS (in millions) ( Year Ended December 31, 2018 2019 CASH, CASH EQUIVALENTS, AND RESTRICTED CASH, BEGINNING OF PERIOD 21,856 32.173 OPERATING ACTIVITIES: Net income 10.073 11,588 nuusunen Adjustments to reconcile net income to net cash from operating activities: ser Depreciation and amortization of property and equipment and capitalized content costs, operating lease assets, and other 15,341 21.789 Stock-based compensation 5,418 6.864 Other operating expense (income), net 274 164 Other expense (income), net 219 (249) Deferred income taxes 441 796 Changes in operating assets and liabilities: Inventories (1,314) (3,278) Accounts receivable, net and other (4.615) (7,681) Accounts payable 3.263 8,193 Accrued expenses and other 472 Unearned revenue 1.151 1,711 25.251 9,208 (71) (2.582 (554) (2.849) (8.169) 17.480 5,754 1.265 (1,383) 1.151 30,723 1.711 38,514 1.265 66,064 (13.427) 2,104 (2.186) 8,240 (7.100) (12,369) (16,861) 4.172 (2.461) 22.681 (31,812) (24.281) (40,140) 5,096 (2.325) 50,237 (72.479) (59,611) Unearned revenue Net cash provided by (used in) operating activities INVESTING ACTIVITIES Purchases of property and equipment Proceeds from property and equipment sales and incentives Acquisitions, net of cash acquired, and other Sales and maturities of marketable securities Purchases of marketable securities Net cash provided by used in) investing activities FINANCING ACTIVITIES: Proceeds from short-term debt, and other Repayments of short-term debt, and other Proceeds from long-term debt Repayments of long-term debt Principal repayments of finance leases Principal repayments of financing obligations Net cash provided by (used in) financing activities Foreign currency effect on cash, cash equivalents, and restricted cash Net increase (decrease) in cash, cash equivalents, and restricted cash CASH, CASH EQUIVALENTS, AND RESTRICTED CASH, END 886 (813) 182 (155) (7,449) (337) (7.686) 1,402 (1,518) 871 (1,166) (9,628) (27) (10,066) 6.796 (6,177) 10.525 (1,553) (10.642) (53) (1,104) (351) 70 618 10,317 32.173 4.237 36.410 5.967 42.377 2018 2019 2020 ASSETS Current assets: Cash and cash equivalents Marketable securities Inventories Accounts receivable, net and other Total current assets 31.750 9,500 17.174 16,677 75,101 36,092 18,929 20,497 20.816 96,334 42,122 42.274 23,795 24,542 132,733 Property and equipment, net 61.797 72.705 113, 114 61,797 Property and equipment, net Operating leases Goodwill Other assets Total assets 14,548 11.202 162,648 72.705 25.141 14,754 16,314 225.248 113,114 37,553 15.017 22.778 321,195 LIABILITIES AND STOCKHOLDERS' EQUITY Current liabilities: Accounts payable Accrued expenses and other Unearned revenue Total current liabilities 38.192 23.663 6.536 68,391 47.183 32.439 8,190 87,812 72.539 44,138 9.708 126,385 9,650 23,495 17,563 39.791 23.414 12,171 52.573 31.816 17,017 Long-term lease liabilities Long-term debt Other long-term liabilities Commitments and contingencies (Note 7) Stockholders' equity Preferred stock, 50.01 par value: Authorized shares - 500 Issued and outstanding shares - none Common stock, 50.01 par value: Authorized shares - 5,000 Issued shares - 521 and 527 Outstanding shares - 498 and 503 Treasury stock, at cost Additional paid-in capital Accumulated other comprehensive income (loss) Retained earnings Total stockholders' equity Total liabilities and stockholders' equity 5 (1,837) 26,791 (1,035) 19,625 43,549 162,648 5 (1,837) 33,658 (986) 31.220 62,060 225.248 5 (1.837) 42.865 (180) 52.551 93,404 321,195 AMAZON COM INC CASH_FLOW Form Type: 8-K Period End: Oct 28, 2021 Date Filed: Oct 28, 2021 Table of Contents AMAZON.COM, INC. Consolidated Statements of Cash Flows (in millions) ( (unaudited) ) Three Months Ended September 30, Nine Months Ended September 30, Twelve Months Ended September 30, 2020 2021 2020 2021 2020 2021 S S 37.842 s 40.667 S 36.410 S 42.377 S 23,554 5 30,202 6,331 3.156 14,109 19.041 17,377 26,263 CASH, CASH EQUIVALENTS, AND RESTRICTED CASH, BEGINNING OF PERIOD OPERATING ACTIVITIES: Net income Adjustments to reconcile net income to net cash from operating activities: Depreciation and amortization of property and equipment and capitalized content costs operating lease assets, and other , stock based Stock-based compensation Other operating expense (income), net Other expense (income), net Deferred income taxes Changes in operating assets and liabilities: Inventories Accounts receivable, net and other Accounts payable Accrued expenses and other 6.523 2.288 67 (1,051) ) 295 8.948 3.180 24 340 909 17,633 6,646 416 (1.255) 1,082 24.494 9,077 72 (2.374) 23,803 8,486 466 (1,749) 1,267 32,112 11,639 (415) (3,701) 1,677 3.313 (3.899) (2016) 3.658 (310) (7,059) (4.890) 3.832 (1,465) (3,178) (3,608) 4231 (1.375) (7.572) (11,607) (4,387) (7.210) (4,694) (7,515) 14,914 1,520 (7.242) (16,168) 8,863 (84) (310) 78 (1.465) 338 (1,375) 932 (7.210) 1.394 1,520 1,417 (84) 1,727 11.964 7,313 35,633 24.241 55,292 54,671 (11,063) ( (15,748) (25,317) (42.118) (30,629) (56,941) Accrued expenses and other Unearned revenue Net cash provided by (used in) operating activities INVESTING ACTIVITIES: Purchases of property and equipment Proceeds from property and equipment sales and incentives Acquisitions, net of cash acquired, and other Sales and maturities of marketable securities Purchases of marketable securities Net cash provided by (used in) investing activities FINANCING ACTIVITIES 1.255 (1.735) 13.135 (17,468) ) 997 (654) 15,808 (15.231) 3,467 (1.945) 32,899 (51,678) 3.192 (1.604) 46.847 (51,891) 4,838 (2,722) 40,525 (58,122) 4,822 (1,985) 64,185 (72,692) (15,876) (14,828) (42,574) (45,574) (46,110) ) (62,611) 1,311 (1.349) 2.187 (1.917) 176 (509) (2.693) (20) 4.361 (3,886) 9.994 (1.439) (8,274) 7,724 (7,385) 19,334 5,289 (5,094) 18,803 (589) (8,903) (115) 5,042 (4.701) 10,412 (2,490) (11,054) (68) (1.198) (2,857) (12) () (703) (11,271) (124) (4.105) (2.776) 712 9.391 (2,859) 7,575 Proceeds from short-term debt, and other Repayments of short-term debt, and other Proceeds from long-term debt Repayments of long-term debt Principal repayments of finance leases Principal repayments of financing obligations Net cash provided by (used in) financing activities Foreign currency effect on cash, cash equivalents, and restricted cash Net increase (decrease) in cash, cash equivalents, and restricted cash CASH, CASH EQUIVALENTS, AND RESTRICTED CASH, END OF PERIOD END SUPPLEMENTAL CASH FLOW INFORMATION: Cash paid for interest on debt Cash paid for operating leases Cash paid for interest on finance leases 377 (199) 21 (258) 325 340 (7.640) (10,490) (6,208) ) (12,200) 6,648 (25) $ 30,202 s 30.177 $ 30,202 $ 30,177 $ 30,202 S 30,177 $ 285 S 1.159 155 276 5 1.812 121 715 5 3,275 484 731 $ 5,029 407 869 $ 4,215 650 933 6,230 535 28 502 6.115 48 750 10.447 71 1293 11.870 116 3.354 19.561 90 1,481 14,346 147 3,774 23,908 Cash paid for interest on financing obligations Cash paid for income taxes, net of refunds Assets acquired under operating leases Property and equipment acquired under finance leases Property and equipment acquired under build-to-suit arrangements 3,571 1.744 8.892 5.453 13,075 8.149 366 1.721 1.228 3.702 1,480 4,742 AMAZON COM INC INCOME STATEMENT Form Type: 8-K Period End: Oct 28, 2021 Date Filed: Oct 28, 2021 Table of Contents AMAZON.COM, INC Consolidated Statements of Operations (in millions, except per share data) (unaudited) Three Months Ended September 30, Nine Months Ended September 30, 2021 2020 2021 2020 $ 52.774 S 43,371 96,145 54.876 S 55,936 110,812 144,859 $ 115,650 260,509 170.371 162,039 332,410 Net product sales Net service sales Total net sales Operating expenses Cost of sales Fulfillment Technology and content 57,106 14.705 10.976 62.930 18.498 14.380 154 023 40 043 30.691 189,509 52.666 40.739 10.976 5,434 1,668 62 89,951 6,194 118 Technology and content Marketing General and administrative Other operating expense (income), net Total operating expenses Operating income Interest income Interest expense Other income (expense), net Total non-operating income (expense) Income before income taxes Provision for income taxes Equity-method investment activity, net of tax Net income Basic earnings per share Diluted earnings per share Weighted average shares used in computation of earnings per share: Basic Diluted 14,380 8,010 2.153 (11) 105,960 4.852 119 (493) (163) (537) 4.315 (1,155) (428) 925 615 6,809 (569) 91 6,331 5 12.63 $ 12.37 s 30,691 14,605 4.700 421 244,483 16,026 455 (1.233) 1,165 387 16,413 (2,298) (6) 14,109 28.24 $ 27.72 5 40.739 21.741 6.298 38 310.991 21.419 330 (1,327) 2.795 1,798 23.217 (4,179) 3 19.041 37.69 37.02 3,156 6.23 6.12 s 501 507 500 512 505 514 515 509 Created by EDGAR Online, Inc. AMAZON COM INC BALANCE_SHEET Form Type: 8-K Period End: Oct 28, 2021 Date Filed: Oct 28, 2021 Table of Contents AMAZON.COM, INC Consolidated Balance Sheets (in millions, except per share data) AMAZON.COM, INC. Consolidated Balance Sheets (in Millions, except per share data) December 31, September 30, 2020 2021 (unaudited) 42,122 5 42.274 23,795 24,542 132.733 113,114 37,553 15,017 22,778 321, 1955 29,944 49,044 30,933 28.610 138,531 147,152 52,151 15.345 29.227 382,406 S ASSETS Current assets: Cash and cash equivalents Marketable securities Inventories Accounts receivable, net and other Total current assets Property and equipment, net Operating leases Goodwill Other assets Total assets LIABILITIES AND STOCKHOLDERS' EQUITY Current liabilities: Accounts payable Accrued expenses and other Unearned revenue Total current liabilities Long-term lease liabilities Long-term debt Other long-term liabilities Commitments and contingencies Stockholders' equity Preferred stock, 30.01 par value: Authorized shares - 500 Issued and outstanding shares - none $ 72,539 $ 44,138 9,708 126,385 52,573 31,816 17,017 71,474 41,546 10,974 123,994 63,848 50.055 23.945 Issued and outstanding shares - none Common stock, 50.01 par value: Authorized shares - 5,000 Issued shares - 527 and 530 Outstanding shares - 503 and 507 Treasury stock, at cost Additional paid-in capital Accumulated other comprehensive income (loss) Retained earnings Total stockholders' equity Total liabilities and stockholders' equity 5 (1.837) 42.865 (180) 52.551 93,404 321,195 $ 5 (1,837) 51,879 (1,075) 71.592 120,564 382 406 s eBay Inc. Unaudited Condensed Consolidated Statement of Income Three Months Ended Nine Months Ended September 30, September 30, 2021 2020 2021 2020 (in millions, except per share amounts) 2501 $ 2.258 $ 7,807 $ 678 478 1.966 1.249 1.823 1.780 5.851 5.167 $ 6.416 496 334 219 112 Net revenues Cost of net revenues Gross profit Operating expenses Sales and marketing Product development General and administrative Provision for transaction losses Amortization of acquired intangible assets Total operating expenses Income from operations Interest and other net Income from continuing operations before income taxes Income tax provision Income from continuing operations Income (loss) from discontinued operations, net of income taxes Net income 528 271 253 60 6 1.118 1.601 ses 715 303 9 3,616 2.235 (676) 1.569 (414) 1.145 $ 1445 745 737 245 20 2.192 1.975 1,161 882 (228) 434 (151) 283 $ 278 94 756 (151) 805 $ 2.251 (536) 1,715 $ (19) 264 $ 59 664 $ 10.494 11.639 $ 3.107 4,822 2.39 Income (los) per share-basic: Continuing operations Discontinued operations Niet income per share basic 0.44 $ (0.03) 0.41 $ 0.87 $ 0.08 0.95 $ 1.72 15.72 17.44 6.72 $ Income (los) per share-diluted: Continuing operations Discontinued operations Net income per share. diluted 0.43 $ 10.03) 0.40 $ 0.88 $ 0.08 0.94 $ 1.69 $ 15.47 17.16 $ 2.37 4.28 6.65 0.40 $ 0.94 $ 17.16 $ 6.65 847 65 717 725 708 678 Net income per share - diluted Weighted average shares: Basic Diluted (1) Includes stock based compensation as follows: Cost of net revenues Sales and marketing Product development General and administrative 12 $ 25 50 40 127 $ 10$ 23 37 40 110 $ 35 $ 70 147 113 365 $ 113 101 301 $ 119 110 301 1 71 eBay Inc. Unaudited Condensed Consolidated Statement of Cash Flows Three Months Ended Nine Months Ended September 30, September 30. 2021 2020 2021 2020 in millions) Cash flows from operating activities Net income 254 5 6545 11.639 5 4822 Income) loss from discontinued operations, net of income taxes 19 (59 (10,4947 (3.107) AGustments: Provision for transaction losses 112 60 245 Depreciation and amortization 157 452 Stock-based compensation 127 (Gain) loss an investments, net 5 (1) Deferred income taxes (65) 177 Change in fair value of warrant (311) (191) (496 Change in fair value of equity investment in Adevinta 1,075 Gain on equity investment in Kakao@ank (586) (Gain los an extinguishment of debt Changes in assets and abilities, net of acquisition effects (89) (185) (221) Net cash provided by continuing operating activites 545 Niet cash provided by used in discontinued operating activities (406) 541) 5131 Net cash provided by operating activities 256 105 1661 Cash flows from investing activities Purchases of property and equipment (159) (124) (341) (308 Purchases of investments 15.427) (7.224 (15.1031 (28 897) Maturities and sales of investments 7,101 9,074 29 740 Other Net cash provided by used in continuing investing activities 1,524 1,725 (1.565 Net cash provided by used in) discontinued investing activities 0 (15) 4006 Net cash provided by used in investing activities 1,523 1,711 3.580 Cash flows from financing actvities: Proceeds from issuance of common stock Repurchases of common stock (2.230) 580) (3.966 (4.710) Payments forts related to not share settlements of restricted stock units and awards (Se (196) (131) 661 2174 % @ $ | #| | |3| 5 55 (58) (116) (111) (185) (359) 2478 (1.156) (109) 6 (3.2471 (131) (337) 1.765 (1.771) 1932) (139) 15 (1.771) 15.134 (2.562) 64 (2.490 (1.773 (3.245 (5.143) Payments forts related to net share settlements of restricted stock units and awards Payments for dividends Proceeds tom issuance of long-term debt, net Repayment of date Net funds receivable and payable activity Other Net cash provided by used in continuing financing activities Net cash provided by used in) discontinued financing activities Niet cash provided by used in financing activities Effect of exchange rate changes on cash cash equivalents and restricted cash Net increase in cash, cash equivalents and restricted cash Cash, cash equivalents and restricted cash at beginning of period Cash, cash equivalents and restricted cash at end of period Less Cash and cash equivalents and restricted cash of held for sale Less Cash, cash equivalents and restricted cash of discontinued Cash cash equivalents and restricted cash of continuing operations at end of period 51 94 25 123 (685) 2,306 1,621 30 27 1.594 1.621 1,119 1.119 352 278 278 30 $ 1.269 $ 811 5 811 eBay Inc. Unaudited Condensed Consolidated Balance Sheet September 30, December 31, 2021 2020 (In millions) 1,101 2.392 1.244 S 4,038 9.279 93 567 965 1.570 ASSETS Current assets: Cash and cash equivalents Short-term investments Equity investment in Adevinta Accounts receivable, net of allowance for doubtful accounts of $66 and $97 Customer accounts and funds receivable Other current assets Current assets held for sale Current assets of discontinued operations Total current assets Long-term investments Property and equipment, net Goodwill Intangible assets, net Operating lease right-of-use assets Deferred tax assets Warrant asset Other assets Long-term assets held for sale Total assets LIABILITIES AND STOCKHOLDERS' EQUITY 17.756 933 1.225 4.138 3 338 3.297 1.434 133 362 290 780 1,077 1,188 7.190 833 1.292 4,285 12 430 3.537 1,051 131 549 19,310 $ 29,257 S 278 1,355 $ 265 621 1.864 85 176 930 LIABILITIES AND STOCKHOLDERS' EQUITY Current liabilities: Short-term debt Accounts payable Customer accounts and funds payable Accrued expenses and other current liabilities Deferred revenue Income taxes payable Current liabilities held for sale Current liabilities of discontinued operations Total current liabilities Operating lease labilities Deferred tax liabilities Long-term debt Other liabilities Long-term liabilities held for sale Total liabilities Total stockholders' equity Total liabilities and stockholders' equity 5.296 224 3,904 7.727 1,161 379 1,767 98 167 855 452 4,002 316 2.368 7,740 1.260 63 15.749 18,312 10.945 29.257 S 3.561 19,310 $
Step by Step Solution
There are 3 Steps involved in it

Get step-by-step solutions from verified subject matter experts