

Question: Financial information for Buckle is presented in Appendix B at the end of the book. Required: 1. For the most recent year, what is the
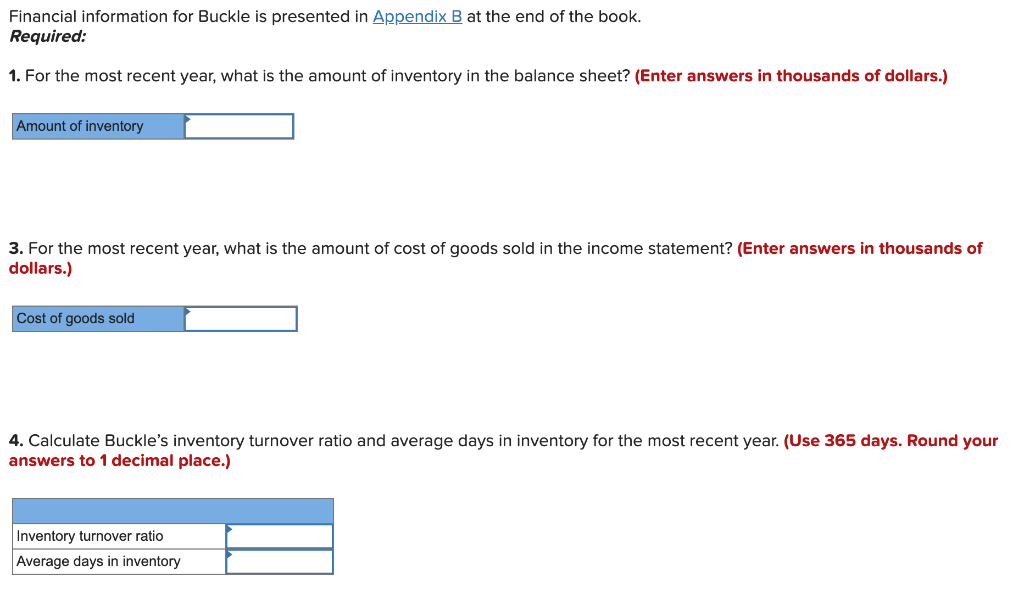
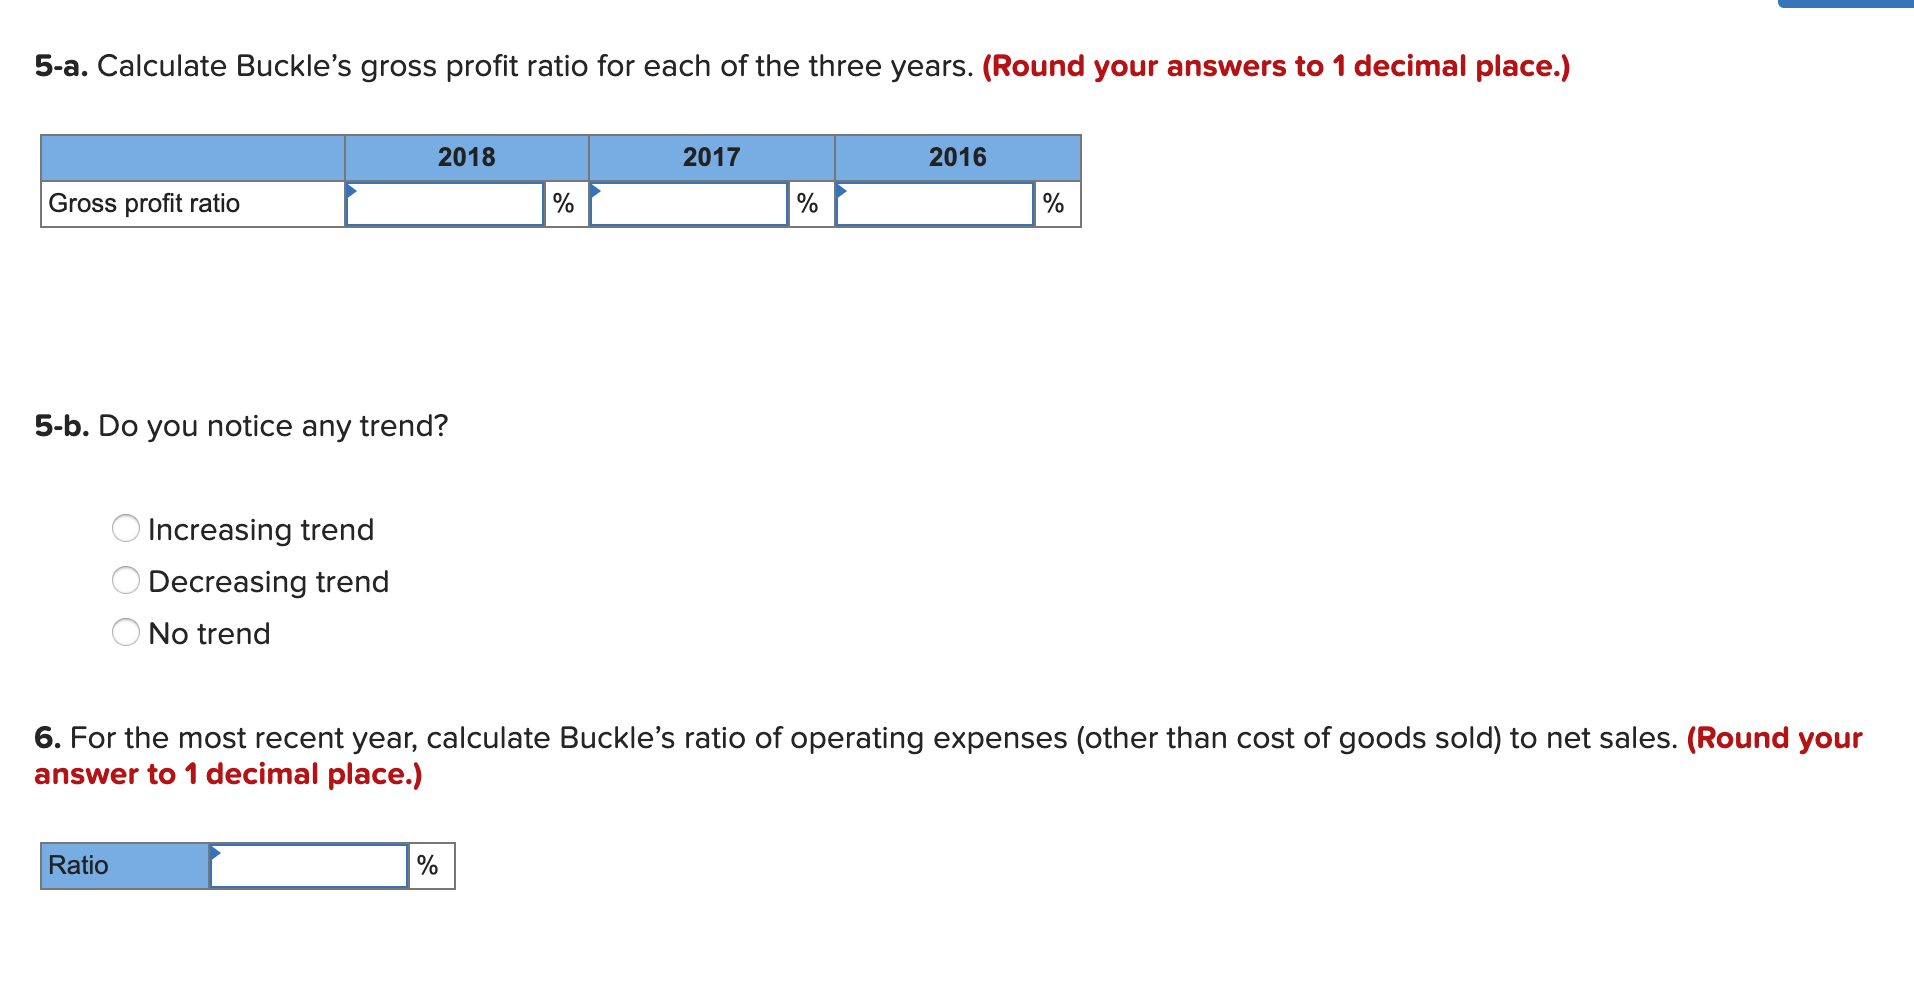
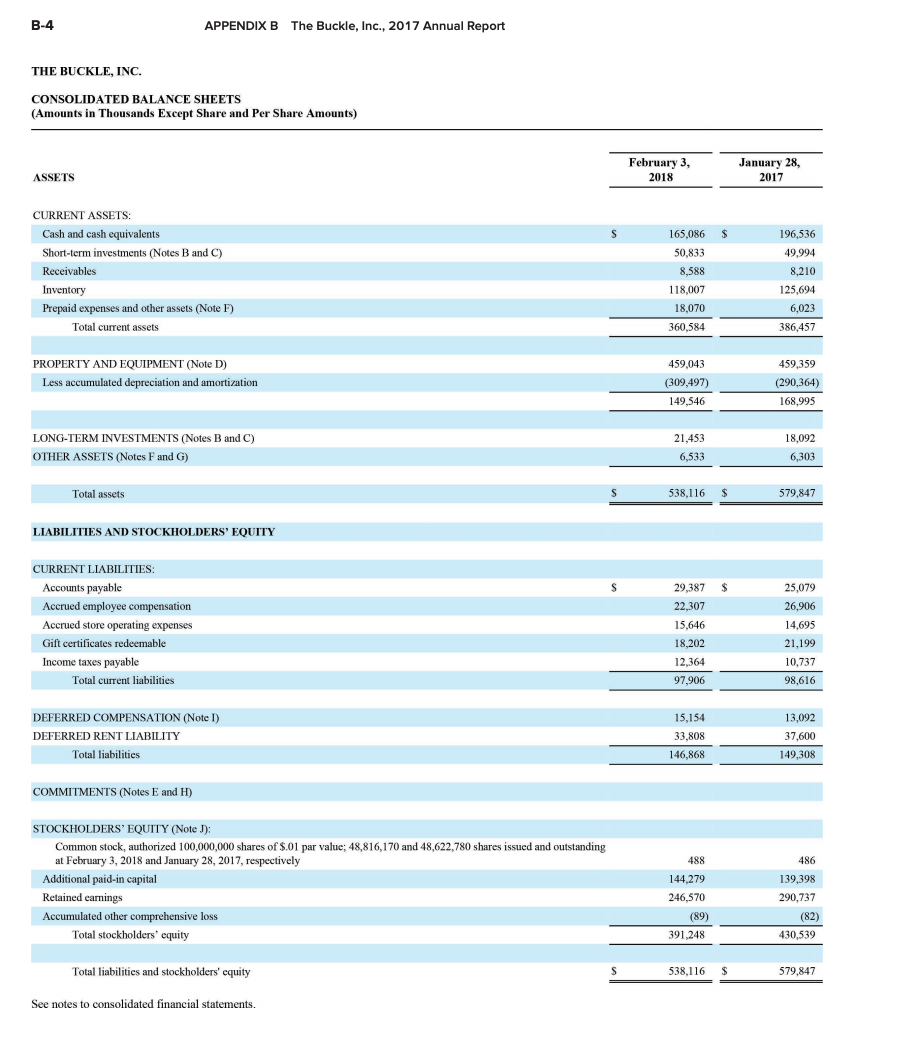
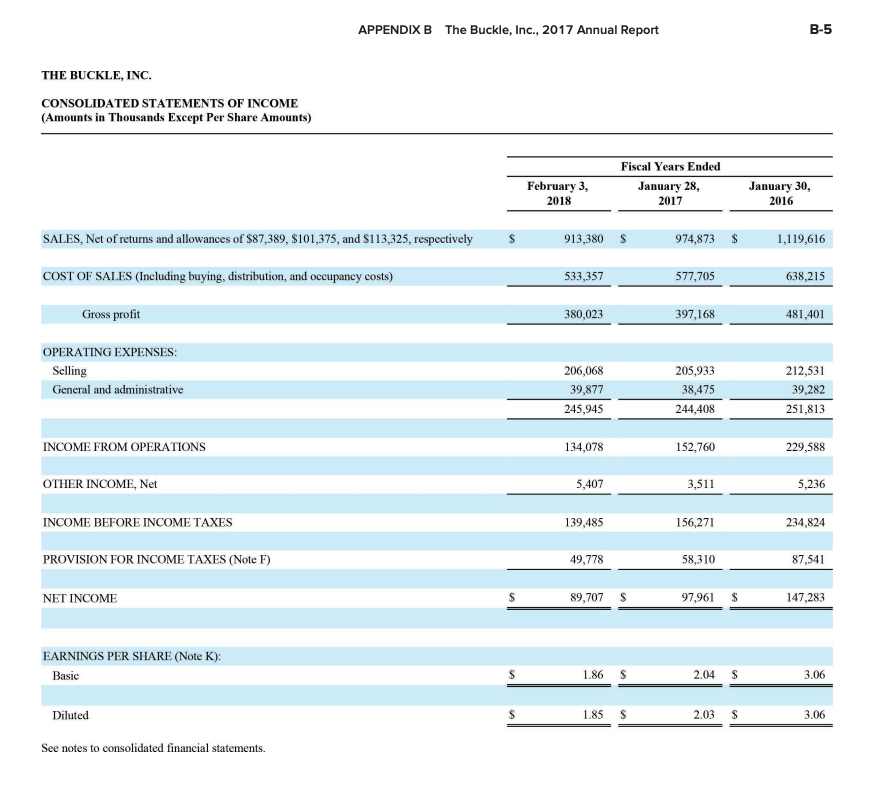
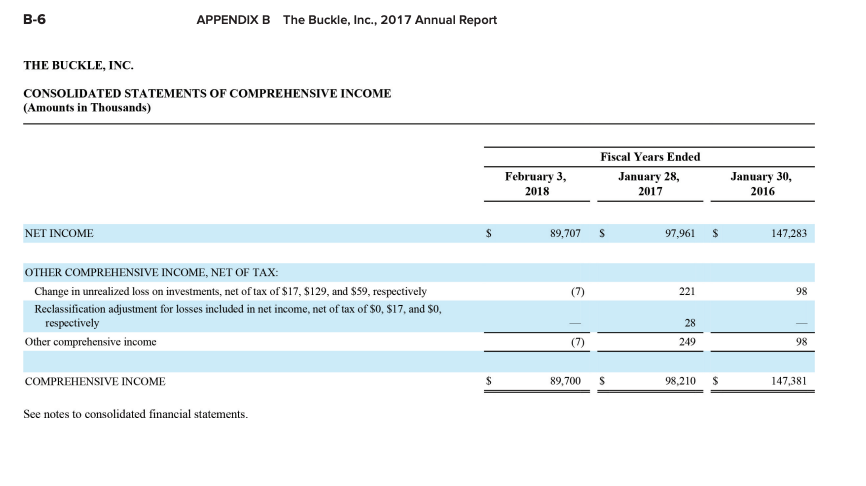
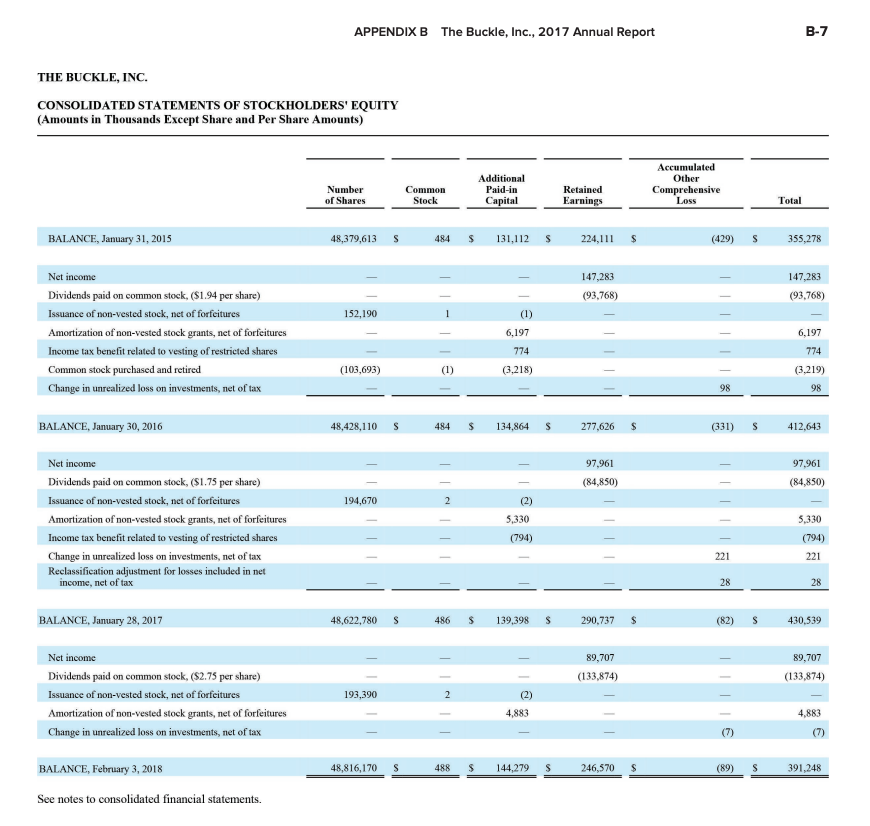
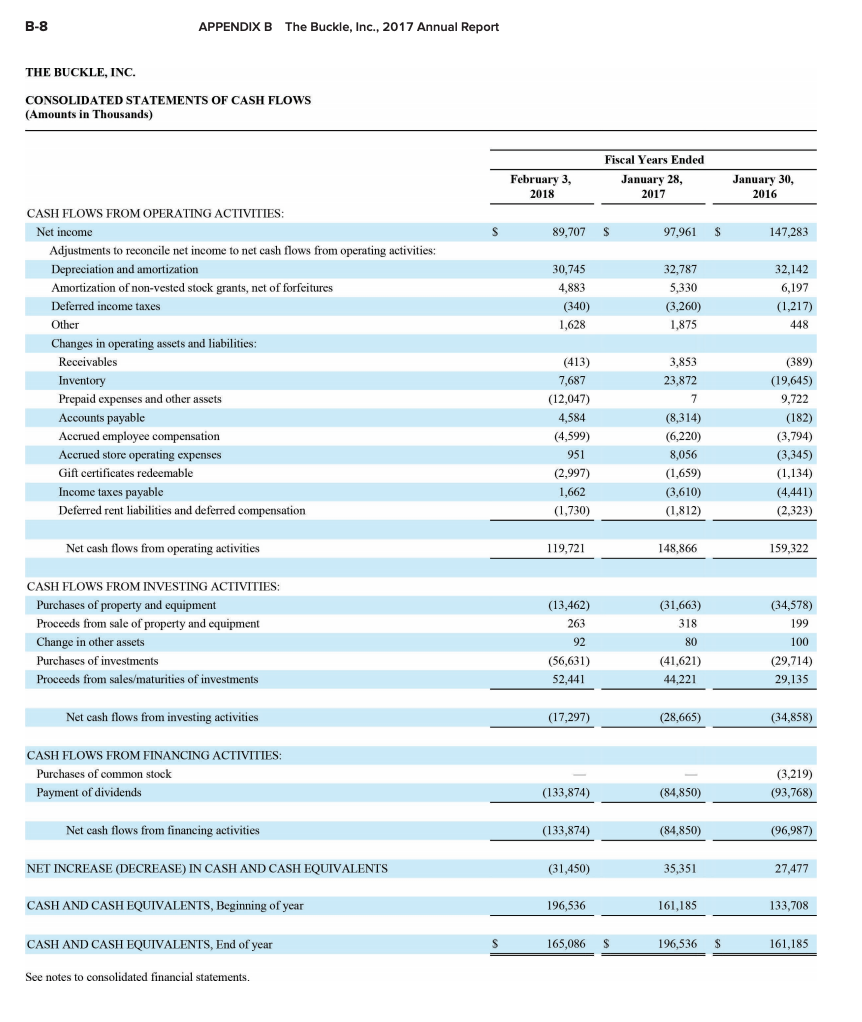
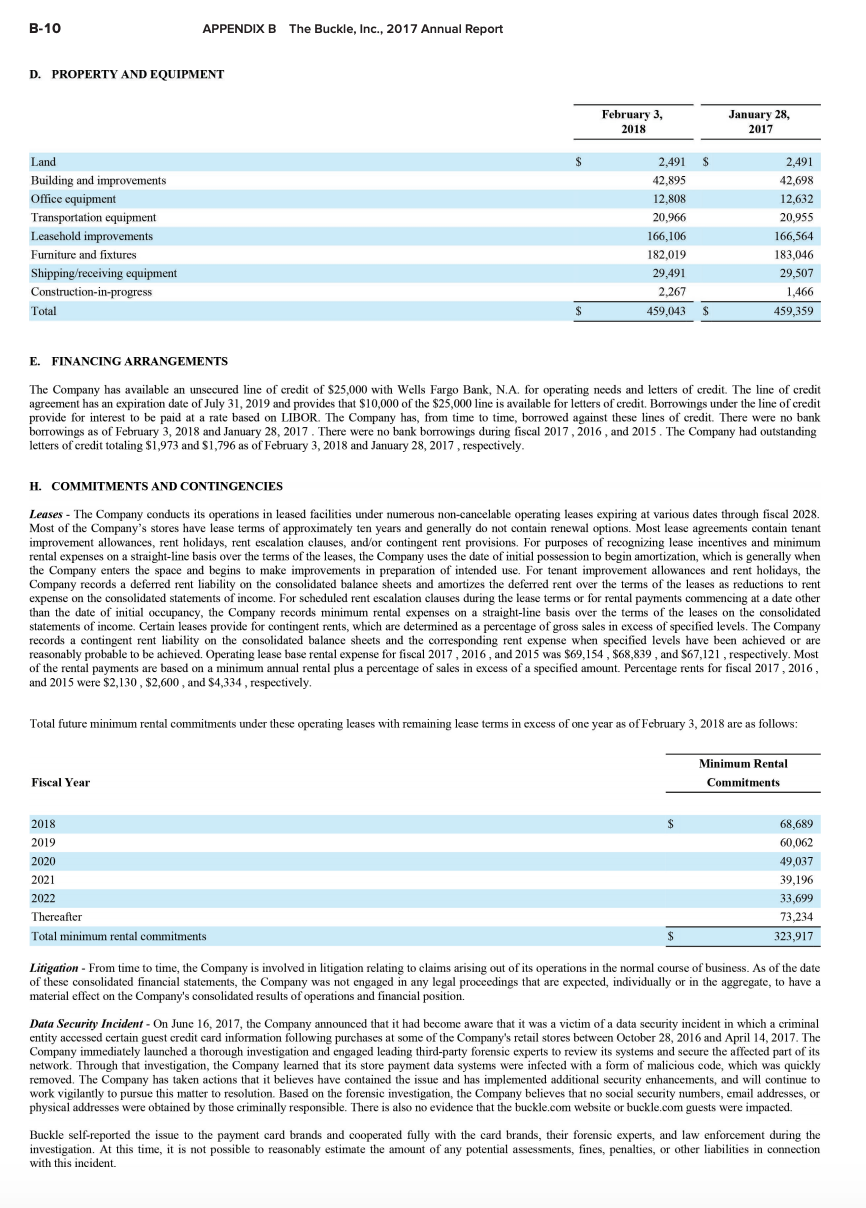
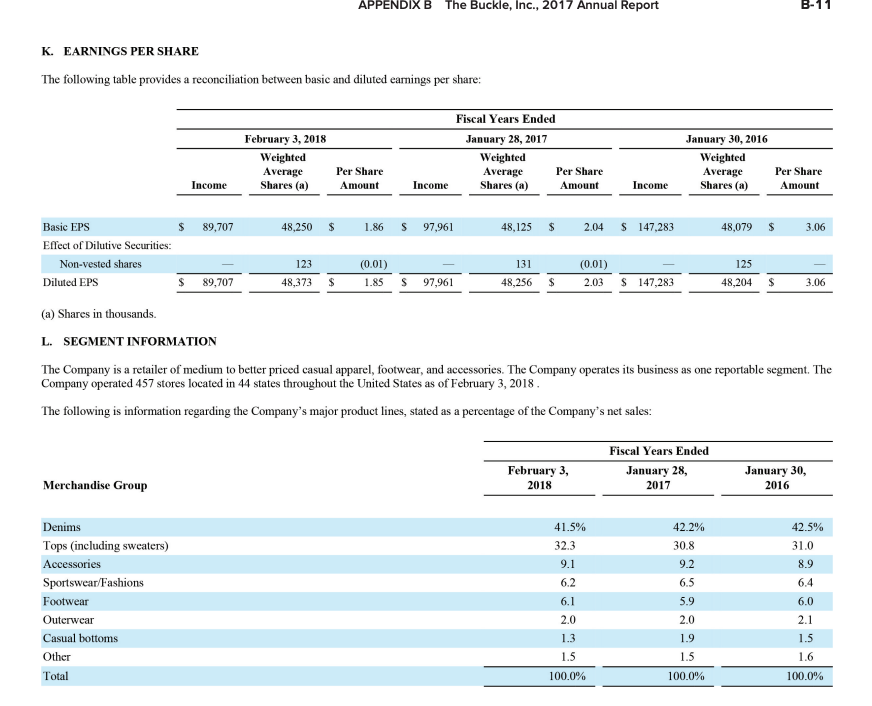
Financial information for Buckle is presented in Appendix B at the end of the book. Required: 1. For the most recent year, what is the amount of inventory in the balance sheet? (Enter answers in thousands of dollars.) Amount of inventory 3. For the most recent year, what is the amount of cost of goods sold in the income statement? (Enter answers in thousands of dollars.) Cost of goods sold 4. Calculate Buckle's inventory turnover ratio and average days in inventory for the most recent year. (Use 365 days. Round your answers to 1 decimal place.) Inventory turnover ratio Average days in inventory 5-a. Calculate Buckle's gross profit ratio for each of the three years. (Round your answers to 1 decimal place.) 2018 2016 2017 2016 Gross profit ratio % , % % 5-b. Do you notice any trend? O Increasing trend O Decreasing trend O No trend 6. For the most recent year, calculate Buckle's ratio of operating expenses (other than cost of goods sold) to net sales. (Round your answer to 1 decimal place.) Ratio B-4 APPENDIX B The Buckle, Inc., 2017 Annual Report THE BUCKLE, INC. CONSOLIDATED BALANCE SHEETS (Amounts in Thousands Except Share and Per Share Amounts) February 3, 2018 January 28, 2017 ASSETS S $ CURRENT ASSETS: Cash and cash equivalents Short-term investments (Notes B and C) Receivables 165,086 50,833 8,588 118,007 18,070 360,584 196,536 49.994 8,210 125,694 6,023 386,457 Inventory Prepaid expenses and other assets (Note F) Total current assets PROPERTY AND EQUIPMENT (Note D) Less accumulated depreciation and amortization 459,043 (309,497) 149,546 459,359 (290,364) 168,995 LONG-TERM INVESTMENTS (Notes B and C) OTHER ASSETS (Notes F and G) 21,453 6,533 18,092 6,303 - Total assets S 538,116 $ 579,847 LIABILITIES AND STOCKHOLDERS' EQUITY CURRENT LIABILITIES: $ 29,387 22,307 15,646 Accounts payable Accrued employee compensation Accrued store operating expenses Gift certificates redeemable Income taxes payable Total current liabilities 25,079 26,906 14,695 21,199 10,737 98,616 18,202 12,364 07006 DEFERRED COMPENSATION (Note I) DEFERRED RENT LIABILITY Total liabilities 15,154 33,808 146,868 13,092 37,600 149,308 COMMITMENTS (Notes E and H) STOCKHOLDERS' EQUITY (Note J): Common stock, authorized 100,000,000 shares of $.01 par value; 48,816,170 and 48,622,780 shares issued and outstanding at February 3, 2018 and January 28, 2017, respectively Additional paid-in capital Retained earnings Accumulated other comprehensive loss Total stockholders' equity 488 144,279 246,570 (89) 391,248 486 139,398 290,737 (82) 430,539 Total liabilities and stockholders' equity S 538,116 $ 579,847 See notes to consolidated financial statements. APPENDIX B The Buckle, Inc., 2017 Annual Report B-5 THE BUCKLE, INC. CONSOLIDATED STATEMENTS OF INCOME (Amounts in Thousands Except Per Share Amounts) February 3, 2018 Fiscal Years Ended January 28, 2017 January 30, 2016 SALES, Net of returns and allowances of $87,389, $101,375, and $113,325, respectively S 9 13,380 S 9 74,873 $ 1,119,616 COST OF SALES (Including buying, distribution, and occupancy costs) 533,357 577,705 638,215 Gross profit 380,023 397,168 481,401 OPERATING EXPENSES: Selling General and administrative 206,068 39,877 245,945 205,933 38,475 244,408 212,531 39,282 251,813 INCOME FROM OPERATIONS 134,078 152,760 229,588 OTHER INCOME, Net 5,407 5,236 INCOME BEFORE INCOME TAXES 139,485 156,271 234,824 PROVISION FOR INCOME TAXES (Note F) 49,778 58,310 87,541 NET INCOME S 89,707 $ 97.961 $ 147,283 EARNINGS PER SHARE (Note K): Basic S 1.86 S 2.04 $ 3.06 Diluted S 1.85 S 2.03 $ 3.06 See notes to consolidated financial statements. B-6 APPENDIX B The Buckle, Inc., 2017 Annual Report THE BUCKLE, INC. CONSOLIDATED STATEMENTS OF COMPREHENSIVE INCOME (Amounts in Thousands) Fiscal Years Ended February 3, 2018 January 28, 2017 January 30, 2016 NET INCOME $ 89,707 S 97,961 $ 147,283 221 98 OTHER COMPREHENSIVE INCOME, NET OF TAX: Change in unrealized loss on investments, net of tax of $17, $129, and $59, respectively Reclassification adjustment for losses included in net income, net of tax of $0, $17, and so, respectively Other comprehensive income 28 249 98 COMPREHENSIVE INCOME 89,700 S 98,210 $ 147,381 See notes to consolidated financial statements. APPENDIX B The Buckle, Inc., 2017 Annual Report B-7 THE BUCKLE, INC. CONSOLIDATED STATEMENTS OF STOCKHOLDERS' EQUITY (Amounts in Thousands Except Share and Per Share Amounts) Accumulated Other Comprehensive Loss Number of Shares Additional Paid in Capital Common Stock Retained Earnings Total BALANCE, January 31, 2015 48,379,613 $ 484 $ 131,112 S 224,111 $ (429) S 355,278 Net income Dividends paid on common stock, ($1.94 per share) TI 147,283 (93,768) 147,283 (93.768) 152,190 Issuance of non-vested stock, net of forfeitures Amortization of non-vested stock grants, net of forfeitures Income tax benefit related to vesting of restricted shares Common stock purchased and retired Change in unrealized loss on investments, net of tax (1) 6,197 774 6,197 774 (103,693) (3,218) (3.219) 98 98 BALANCE, January 30, 2016 48,428,110 S 484 $ 134,864 S 277,626 $ (331) S 412,643 - - - 97,961 (84,850) 97,961 (84,850) 194,670 Net income Dividends paid on common stock, ($1.75 per share) Issuance of non-vested stock, net of forfeitures Amortization of non-vested stock grants, net of forfeitures Income tax benefit related to vesting of restricted shares Change in unrealized loss on investments, net of tax Reclassification adjustment for losses included in net income, net of tax 5,330 (794) 5,330 (794) 221 28 28 BALANCE, January 28, 2017 48,622,780 S 486 $ 139,398 $ 290,737 $ (82) S 430,539 89,707 (133,874) 89,707 (133,874) Net income Dividends paid on common stock, (S2.75 per share) Issuance of non-vested stock, net of forfeitures Amortization of non-vested stock grants, net of forfeitures Change in unrealized loss on investments, net of tax 193,390 2 IT I 4,883 4,883 BALANCE, February 3, 2018 48,816,170 S 4 88 144,279 S 246,570 S (89) S 391,248 See notes to consolidated financial statements. B-8 APPENDIX B The Buckle, Inc., 2017 Annual Report THE BUCKLE, INC. CONSOLIDATED STATEMENTS OF CASH FLOWS (Amounts in Thousands) February 3, 2018 Fiscal Years Ended January 28, 2017 January 30, 2016 89,707 $ 97,961 $ 147,283 30,745 4,883 (340) 1,628 32,787 5,330 (3,260) 1,875 32,142 6,197 (1,217) 448 CASH FLOWS FROM OPERATING ACTIVITIES: Net income Adjustments to reconcile net income to net cash flows from operating activities: Depreciation and amortization Amortization of non-vested stock grants, net of forfeitures Deferred income taxes Other Changes in operating assets and liabilities: Receivables Inventory Prepaid expenses and other assets Accounts payable Accrued employee compensation Accrued store operating expenses Gift certificates redeemable Income taxes payable Deferred rent liabilities and deferred compensation 3,853 23,872 (413) 7,687 (12,047) 4,584 (4,599) 951 (2,997) 1,662 (1,730) (8,314) (6,220) 8,056 (1,659) (3,610) (1,812) (389) (19,645) 9,722 (182) (3,794) (3,345) (1,134) (4,441) (2,323) Net cash flows from operating activities 119,721 148,866 159,322 CASH FLOWS FROM INVESTING ACTIVITIES: Purchases of property and equipment Proceeds from sale of property and equipment Change in other assets Purchases of investments Proceeds from sales/maturities of investments (13,462) 263 92 (56,631) 52,441 (31,663) 318 80 (41,621) 44,221 (34,578) 199 100 (29,714) 29,135 Net cash flows from investing activities (17,297) (28,665) (34,858) CASH FLOWS FROM FINANCING ACTIVITIES: Purchases of common stock Payment of dividends (3,219) (93,768) (133,874) (84,850) Net cash flows from financing activities (133,874) (84,850) (96,987) NET INCREASE (DECREASE) IN CASH AND CASH EQUIVALENTS (31,450) 35,351 27,477 CASH AND CASH EQUIVALENTS, Beginning of year 196,536 161,185 133,708 CASH AND CASH EQUIVALENTS, End of year S 1 65,086 $ 196,536 $ 161,185 See notes to consolidated financial statements. B-10 APPENDIX B The Buckle, Inc., 2017 Annual Report D. PROPERTY AND EQUIPMENT February 3, 2018 January 28, 2017 $ Land Building and improvements Office equipment Transportation equipment Leasehold improvements Furniture and fixtures Shipping/receiving equipment Construction-in-progress Total 2,491 42,895 12,808 20,966 166,106 182,019 29,491 2,267 459,043 2,491 42.698 12,632 20,955 166,564 183,046 29,507 1,466 459,359 $ $ E. FINANCING ARRANGEMENTS The Company has available an unsecured line of credit of $25,000 with Wells Fargo Bank, N.A. for operating needs and letters of credit. The line of credit agreement has an expiration date of July 31, 2019 and provides that $10,000 of the $25.000 line is available for letters of credit. Borrowings under the line of credit provide for interest to be paid at a rate based on LIBOR. The Company has, from time to time, borrowed against these lines of credit. There were no bank borrowings as of February 3, 2018 and January 28, 2017. There were no bank borrowings during fiscal 2017, 2016, and 2015. The Company had outstanding letters of credit totaling $1,973 and $1,796 as of February 3, 2018 and January 28, 2017, respectively H. COMMITMENTS AND CONTINGENCIES Leases - The Company conducts its operations in leased facilities under numerous non-cancelable operating leases expiring at various dates through fiscal 2028. Most of the Company's stores have lease terms of approximately ten years and generally do not contain renewal options. Most lease agreements contain tenant improvement allowances, rent holidays, rent escalation clauses, and/or contingent rent provisions. For purposes of recognizing lease incentives and minimum rental expenses on a straight-line basis over the terms of the leases, the Company uses the date of initial possession to begin amortization, which is generally when the Company enters the space and begins to make improvements in preparation of intended use. For tenant improvement allowances and rent holidays, the Company records a deferred rent liability on the consolidated balance sheets and amortizes the deferred rent over the terms of the leases as reductions to rent expense on the consolidated statements of income. For scheduled rent escalation clauses during the lease terms or for rental payments commencing at a date other than the date of initial occupancy, the Company records minimum rental expenses on a straight-line basis over the terms of the leases on the consolidated statements of income. Certain leases provide for contingent rents, which are determined as a percentage of gross sales in excess of specified levels. The Company records a contingent rent liability on the consolidated balance sheets and the corresponding rent expense when specified levels have been achieved or are reasonably probable to be achieved. Operating lease base rental expense for fiscal 2017, 2016, and 2015 was $69,154, $68,839, and $67,121, respectively. Most of the rental payments are based on a minimum annual rental plus a percentage of sales in excess of a specified amount. Percentage rents for fiscal 2017, 2016, and 2015 were $2,130, $2,600, and $4,334, respectively, Total future minimum rental commitments under these operating leases with remaining lease terms in excess of one year as of February 3, 2018 are as follows: Minimum Rental Commitments Fiscal Year $ 2018 2019 2020 2021 2022 Thereafter Total minimum rental commitments 68,689 60,062 49,037 39,196 33,699 73,234 323,917 Litigation - From time to time, the Company is involved in litigation relating to claims arising out of its operations in the normal course of business. As of the date of these consolidated financial statements, the Company was not engaged in any legal proceedings that are expected, individually or in the aggregate, to have a material effect on the Company's consolidated results of operations and financial position. Data Security Incident - On June 16, 2017, the Company announced that it had become aware that it was a victim of a data security incident in which a criminal entity accessed certain guest credit card information following purchases at some of the Company's retail stores between October 28, 2016 and April 14, 2017. The Company immediately launched a thorough investigation and engaged leading third-party forensic experts to review its systems and secure the affected part of its network. Through that investigation, the Company learned that its store payment data systems were infected with a form of malicious code, which was quickly removed. The Company has taken actions that it believes have contained the issue and has implemented additional security enhancements, and will continue to work vigilantly to pursue this matter to resolution. Based on the forensic investigation, the Company believes that no social security numbers, email addresses, or physical addresses were obtained by those criminally responsible. There is also no evidence that the buckle.com website or buckle.com guests were impacted. Buckle self-reported the issue to the payment card brands and cooperated fully with the card brands, their forensic experts, and law enforcement during the investigation. At this time, it is not possible to reasonably estimate the amount of any potential assessments, fines, penalties, or other liabilities in connection with this incident. APPENDIX B The Buckle, Inc., 2017 Annual Report B-11 K. EARNINGS PER SHARE The following table provides a reconciliation between basic and diluted earnings per share: February 3, 2018 Weighted Average Shares (a) Fiscal Years Ended January 28, 2017 Weighted Average Per Share Income Shares (a) Amount January 30, 2016 Weighted Average Shares (a) Per Share Amount Per Share Amount Income Income $ 89,707 48,250 $ 1.86 $ 97,961 48,125 $ 2.04 $147,283 48,079 $ 3.06 Basic EPS Effect of Dilutive Securities: Non-vested shares Diluted EPS 123 48,373 (0.01) 1.85 131 48,256 (0.01) 2.03 125 48,204 - 3.06 $ 89,707 $ $ 97,961 $ $ 147,283 $ (a) Shares in thousands. L. SEGMENT INFORMATION The Company is a retailer of medium to better priced casual apparel, footwear, and accessories. The Company operates its business as one reportable segment. The Company operated 457 stores located in 44 states throughout the United States as of February 3, 2018 The following is information regarding the Company's major product lines, stated as a percentage of the Company's net sales: Fiscal Years Ended January 28, 2017 February 3, 2018 Merchandise Group January 30, 2016 41.5% 32.3 9.1 42.5% 31.0 8.9 6.4 6.2 Denims Tops (including sweaters) Accessories Sportswear/Fashions Footwear Outerwear Casual bottoms Other 6.1 2.0 1.3 1.5 42.2% 30.8 9.2 6.5 5.9 2.0 1.9 1.5 100.0% 6.0 2.1 1.5 1.6 100.0% Total 100.0%
Step by Step Solution
There are 3 Steps involved in it

Get step-by-step solutions from verified subject matter experts