

Question: Financial Statement Analysis Financial Statement Analysis Instructions: 1. Pick a publicly traded company (NIKE, Starbucks, Hershey, Disney). Any company will do. You can find their
Financial Statement Analysis
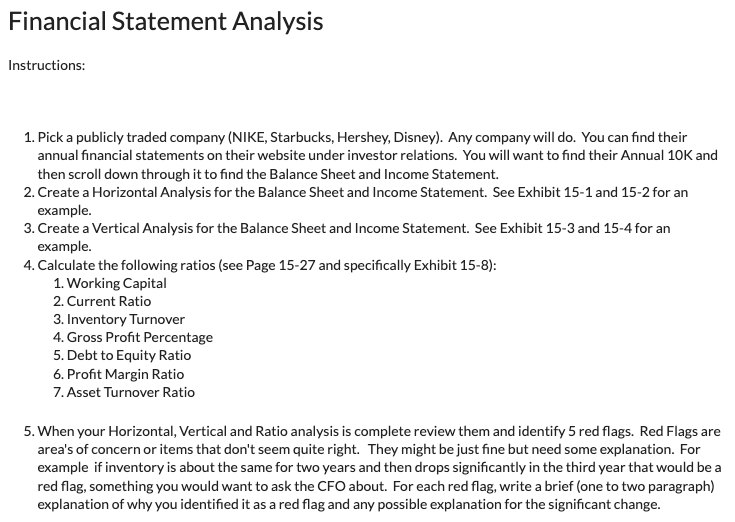
Financial Statement Analysis Instructions: 1. Pick a publicly traded company (NIKE, Starbucks, Hershey, Disney). Any company will do. You can find their annual financial statements on their website under investor relations. You will want to find their Annual 10K and then scroll down through it to find the Balance Sheet and Income Statement. 2. Create a Horizontal Analysis for the Balance Sheet and Income Statement. See Exhibit 15-1 and 15-2 for an example. 3. Create a Vertical Analysis for the Balance Sheet and Income Statement. See Exhibit 15-3 and 15-4 for an example. 4. Calculate the following ratios (see Page 15-27 and specifically Exhibit 15-8): 1. Working Capital 2. Current Ratio 3. Inventory Turnover 4. Gross Profit Percentage 5. Debt to Equity Ratio 6. Profit Margin Ratio 7. Asset Turnover Ratio 5. When your Horizontal, Vertical and Ratio analysis is complete review them and identify 5 red flags. Red Flags are area's of concern or items that don't seem quite right. They might be just fine but need some explanation. For example if inventory is about the same for two years and then drops significantly in the third year that would be a red flag, something you would want to ask the CFO about. For each red flag, write a brief (one to two paragraph) explanation of why you identified it as a red flag and any possible explanation for the significant change. Financial Statement Analysis Instructions: 1. Pick a publicly traded company (NIKE, Starbucks, Hershey, Disney). Any company will do. You can find their annual financial statements on their website under investor relations. You will want to find their Annual 10K and then scroll down through it to find the Balance Sheet and Income Statement. 2. Create a Horizontal Analysis for the Balance Sheet and Income Statement. See Exhibit 15-1 and 15-2 for an example. 3. Create a Vertical Analysis for the Balance Sheet and Income Statement. See Exhibit 15-3 and 15-4 for an example. 4. Calculate the following ratios (see Page 15-27 and specifically Exhibit 15-8): 1. Working Capital 2. Current Ratio 3. Inventory Turnover 4. Gross Profit Percentage 5. Debt to Equity Ratio 6. Profit Margin Ratio 7. Asset Turnover Ratio 5. When your Horizontal, Vertical and Ratio analysis is complete review them and identify 5 red flags. Red Flags are area's of concern or items that don't seem quite right. They might be just fine but need some explanation. For example if inventory is about the same for two years and then drops significantly in the third year that would be a red flag, something you would want to ask the CFO about. For each red flag, write a brief (one to two paragraph) explanation of why you identified it as a red flag and any possible explanation for the significant change
Step by Step Solution
There are 3 Steps involved in it

Get step-by-step solutions from verified subject matter experts