

Question: Financial Statement Analysis Focus on this assignment is to understand what the free cash flow indicates for Coca-Cola base on the past three years? Please
Financial Statement Analysis
Focus on this assignment is to understand what the free cash flow indicates for Coca-Cola base on the past three years? Please turn in your response as if you were presenting informaiton to the CEO also include how this applies if you were an investor.
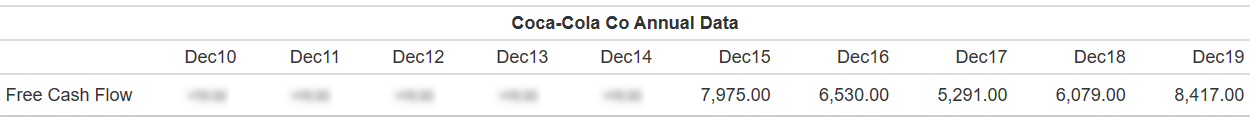
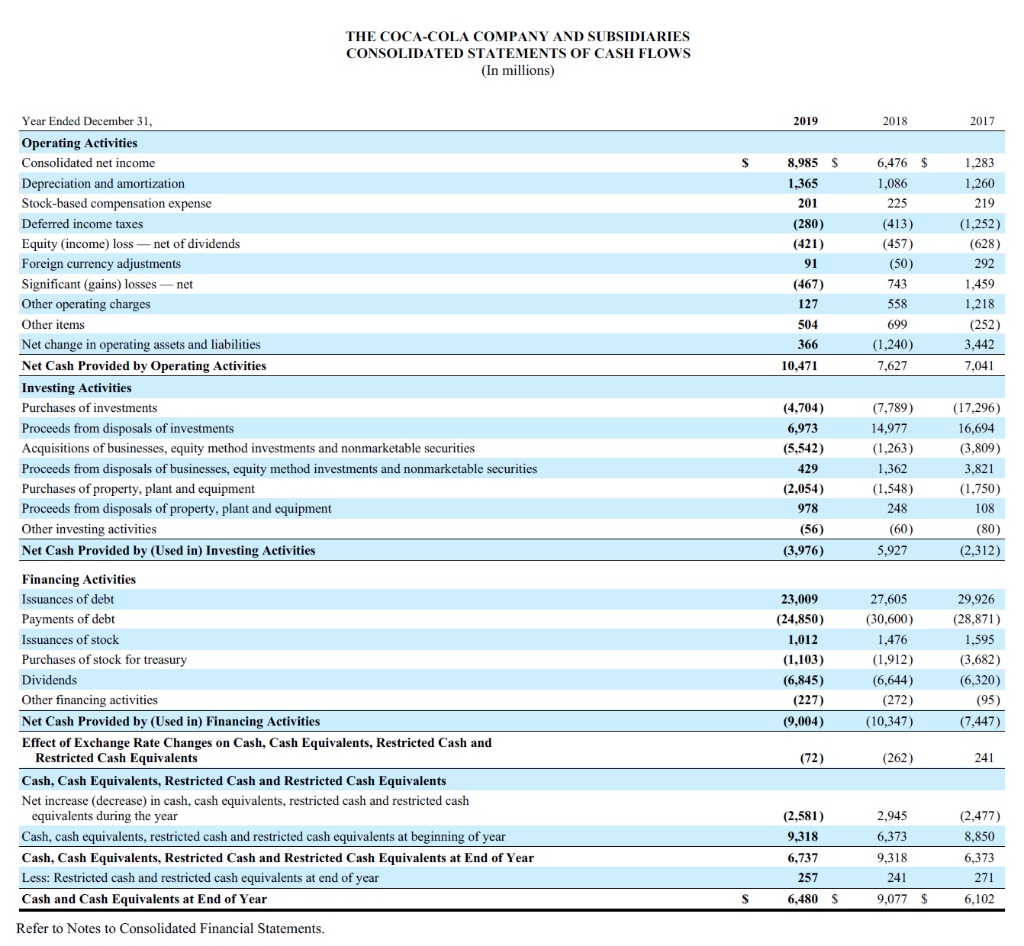
Dec10 Dec11 Dec12 Coca-Cola Co Annual Data Dec13 Dec14 Dec15 7,975.00 Dec16 6,530.00 Dec17 5,291.00 Dec18 6,079.00 Dec19 8,417.00 Free Cash Flow THE COCA-COLA COMPANY AND SUBSIDIARIES CONSOLIDATED STATEMENTS OF CASH FLOWS (In millions) 2019 2018 2017 $ $ 8,985 $ 1,365 201 (280) (421) 91 (467) 127 Year Ended December 31, Operating Activities Consolidated net income Depreciation and amortization Stock-based compensation expense Deferred income taxes Equity (income) loss - net of dividends Foreign currency adjustments Significant (gains) losses - net Other operating charges Other items Net change in operating assets and liabilities Net Cash Provided by Operating Activities Investing Activities Purchases of investments Proceeds from disposals of investments Acquisitions of businesses, equity method investments and nonmarketable securities Proceeds from disposals of businesses, equity method investments and nonmarketable securities Purchases of property, plant and equipment Proceeds from disposals of property, plant and equipment Other investing activities Net Cash Provided by (Used in) Investing Activities 6,476 1,086 225 (413) (457) (50) 743 558 699 (1,240) 7,627 1,283 1,260 219 (1,252) (628) 292 1,459 1,218 (252) 3,442 7,041 504 366 10,471 (4,704) (7,789) 6,973 14,977 (5,542) (1,263) 4291,362 (2,054) (1,548) 978 248 (56) (60) (3,976) 5,927 (17,296) 16,694 (3,809) 3,821 (1,750) 108 (80) (2,312) 23,009 (24,850) 1,012 (1,103) (6,845) (227) (9,004) 27,605 (30,600) 1,476 (1,912) (6,644) (272) (10,347) 29,926 (28,871) 1,595 (3,682) (6,320) (95) (7,447) Financing Activities Issuances of debt Payments of debt Issuances of stock Purchases of stock for treasury Dividends Other financing activities Net Cash Provided by (Used in) Financing Activities Effect of Exchange Rate Changes on Cash, Cash Equivalents, Restricted Cash and Restricted Cash Equivalents Cash, Cash Equivalents, Restricted Cash and Restricted Cash Equivalents Net increase (decrease) in cash, cash equivalents, restricted cash and restricted cash equivalents during the year Cash, cash equivalents, restricted cash and restricted cash equivalents at beginning of year Cash, Cash Equivalents, Restricted Cash and Restricted Cash Equivalents at End of Year Less: Restricted cash and restricted cash equivalents at end of year Cash and Cash Equivalents at End of Year (72) (262) 241 (2,581) 9,318 6,737 257 6,480 $ 2,945 6,373 9,318 241 9,077 $ (2,477) 8,850 6,373 271 6,102 $ Refer to Notes to Consolidated Financial Statements
Step by Step Solution
There are 3 Steps involved in it

Get step-by-step solutions from verified subject matter experts