

Question: Financial Statement Analysis The Statement The Questions: what information do you need? I dont know which questions you are refering to when you say that.
Financial Statement Analysis
The Statement
The Questions:
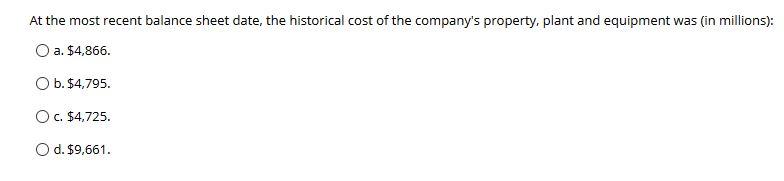
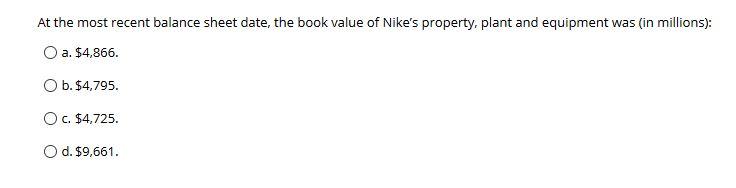
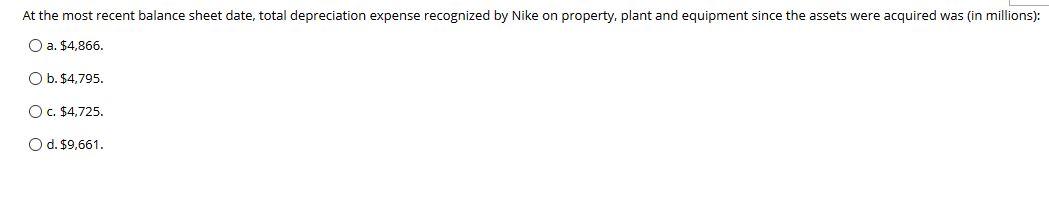
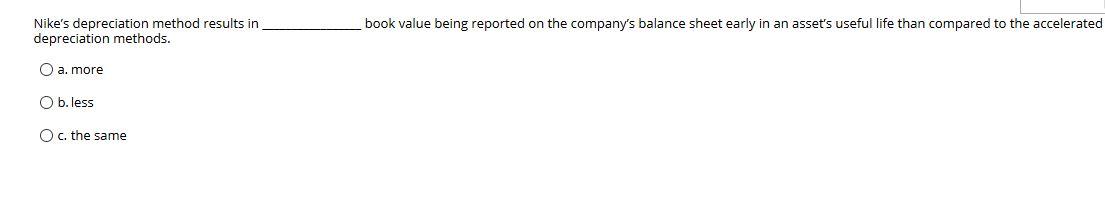
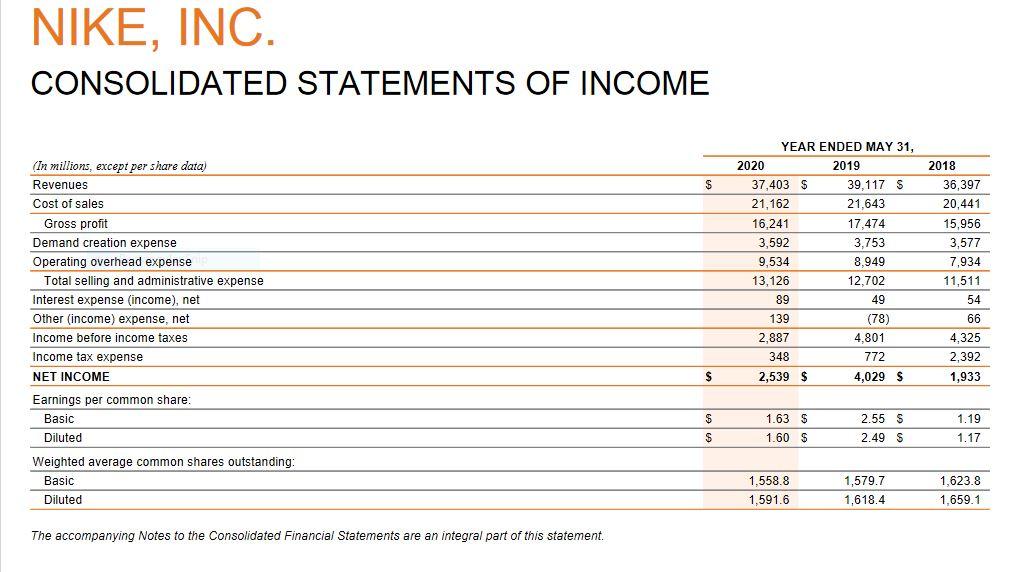
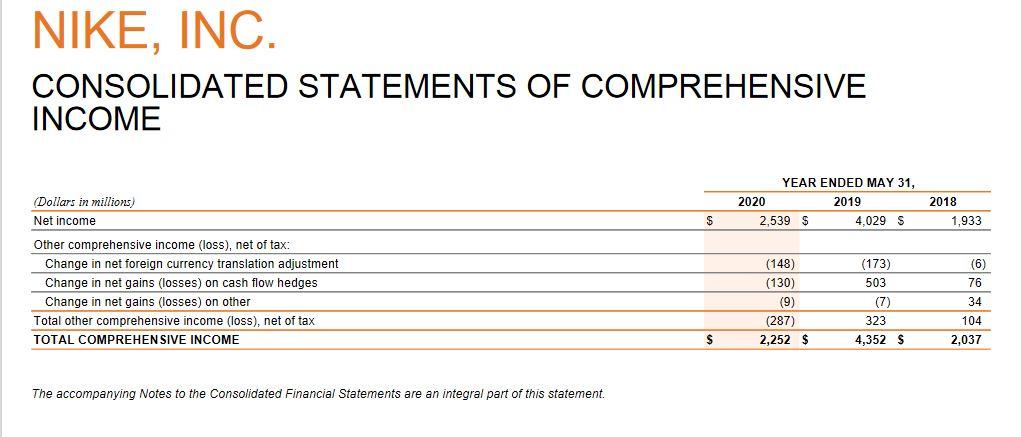
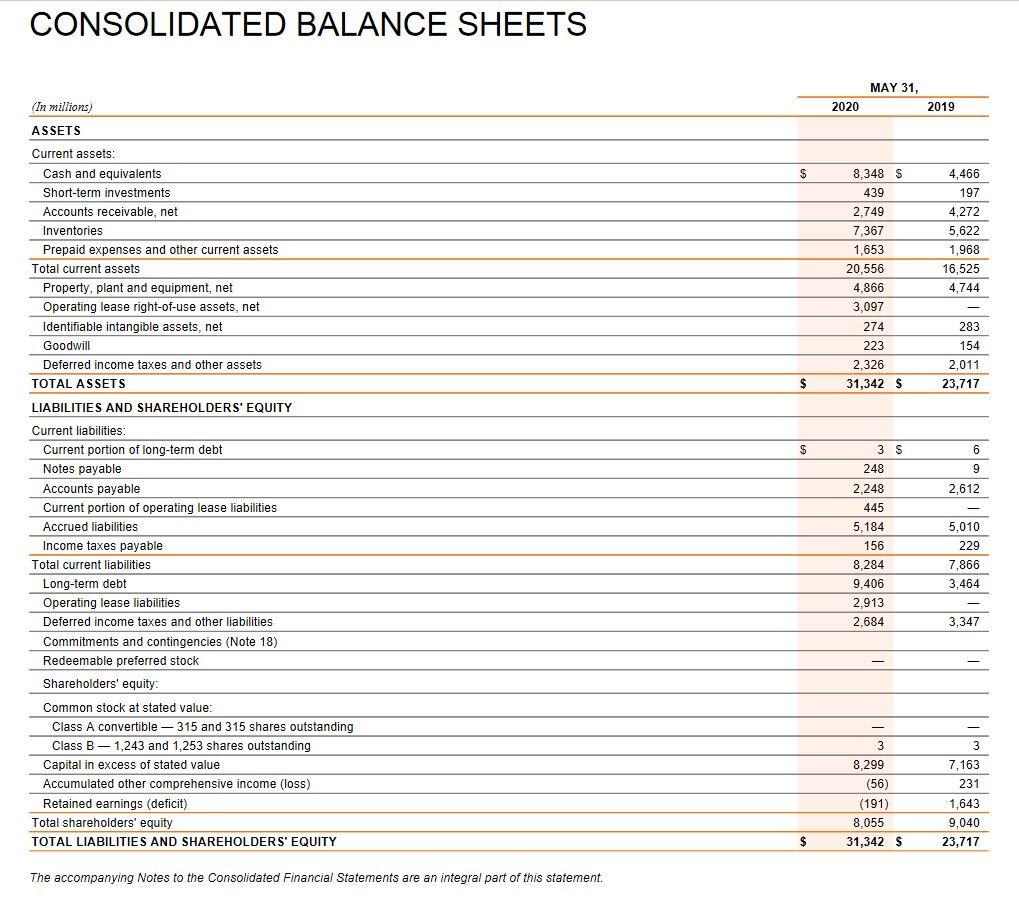
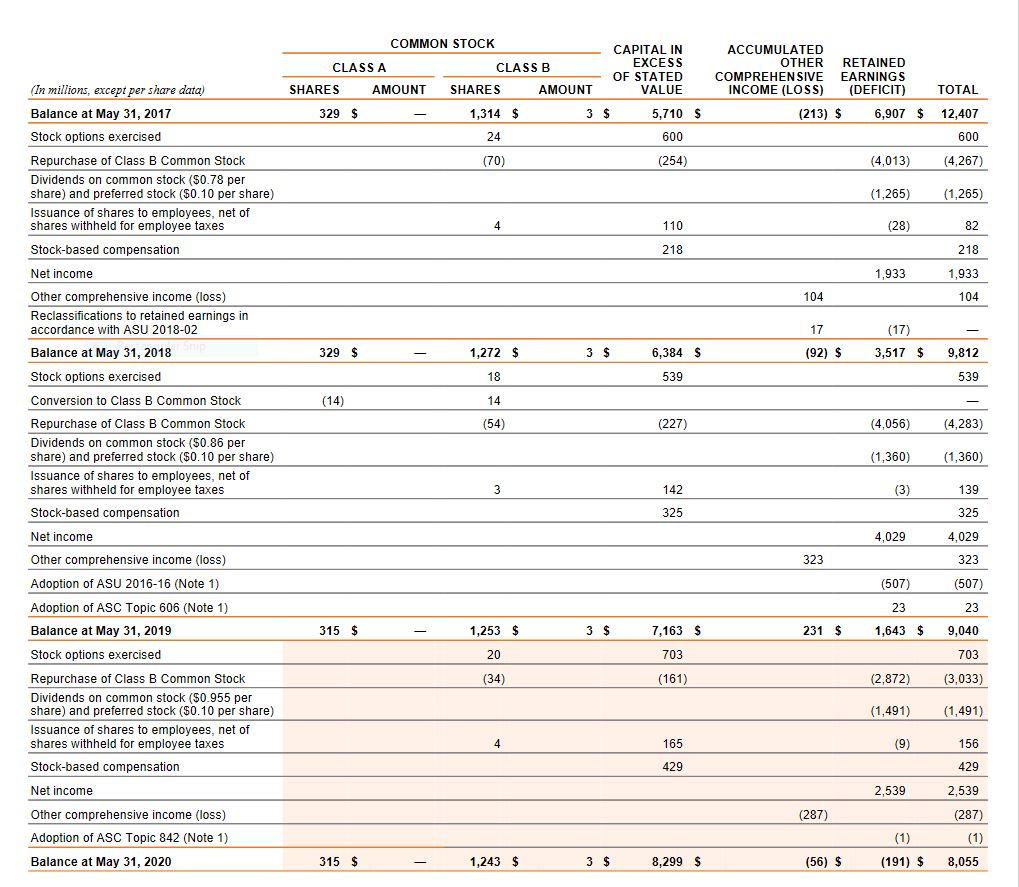
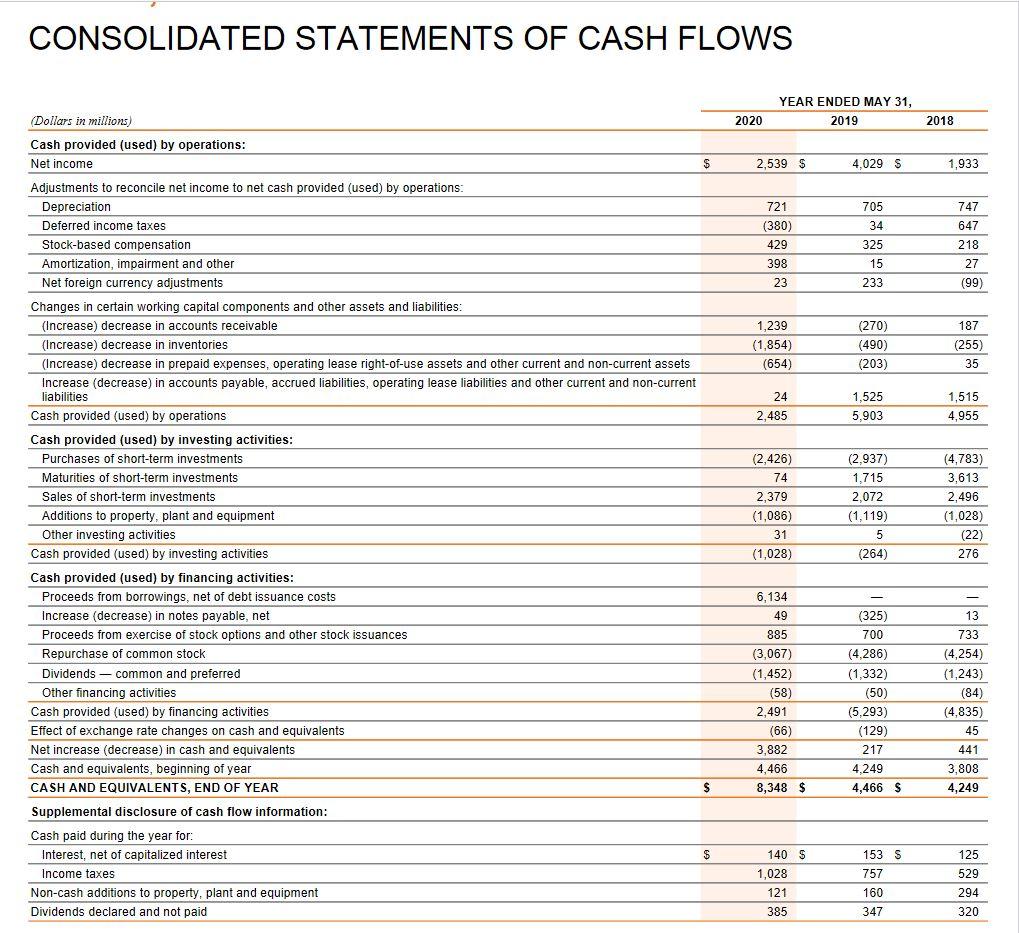
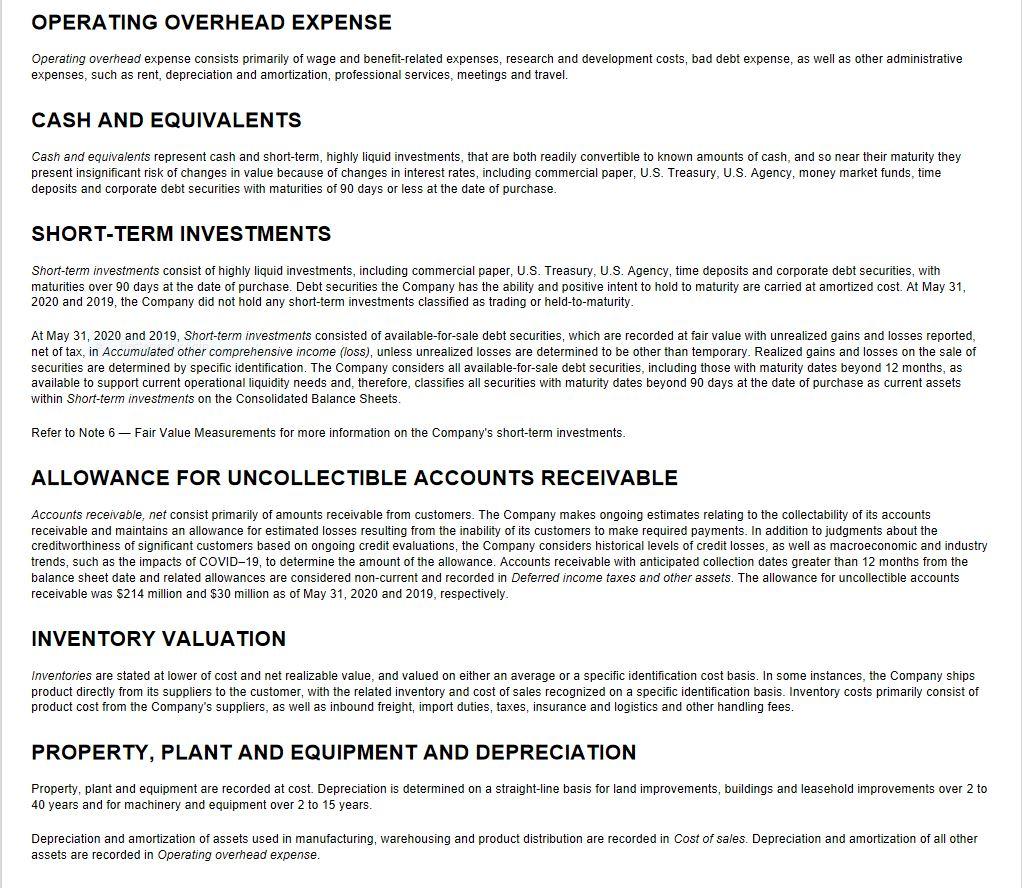
NIKE, INC. CONSOLIDATED STATEMENTS OF INCOME $ (In millions, except per share data) Revenues Cost of sales Gross profit Demand creation expense Operating overhead expense Total selling and administrative expense Interest expense (income), net Other (income) expense, net Income before income taxes Income tax expense NET INCOME Earnings per common share: Basic Diluted Weighted average common shares utstanding: Basic Diluted YEAR ENDED MAY 31, 2020 2019 37,403 $ 39,117 S 21,162 21,643 16,241 17.474 3,592 3,753 9,534 8,949 13,126 12,702 89 49 139 (78) 2,887 4.801 348 772 2,539 $ 4,029 S 2018 36,397 20,441 15,956 3,577 7,934 11,511 54 66 4,325 2,392 1,933 $ 1.63 $ 1.60 $ 2.55 $ 2.49 $ 1.19 1.17 $ 1,558.8 1,591.6 1,579.7 1,618.4 1,623.8 1,659.1 The accompanying Notes to the Consolidated Financial Statements are an integral part of this statement. NIKE, INC. CONSOLIDATED STATEMENTS OF COMPREHENSIVE INCOME (Dollars in millions) Net income YEAR ENDED MAY 31, 2020 2019 2.539 $ 4,029 S 2018 1,933 $ Other comprehensive income (loss), net of tax: Change in net foreign currency translation adjustment Change in net gains (losses) on cash flow hedges Change in net gains (losses) on other Total other comprehensive income (loss), net of tax TOTAL COMPREHENSIVE INCOME (148) (130) (9) (287) 2,252 $ (173) 503 (7) 323 4,352 S (6) 76 34 104 2,037 S The accompanying Notes to the Consolidated Financial Statements are an integral part of this statement. CONSOLIDATED BALANCE SHEETS MAY 31, 2020 2019 $ 8,348 5 439 2,749 7,367 1,653 20,556 4,866 3,097 274 223 2.326 31,342 $ 4,466 197 4,272 5,622 1,968 16,525 4,744 283 154 2,011 23,717 $ S (In millions) ASSETS Current assets: Cash and equivalents Short-term investments Accounts receivable, net Inventories Prepaid expenses and other current assets Total current assets Property, plant and equipment, net Operating lease right-of-use assets, net Identifiable intangible assets, net Goodwill Deferred income taxes and other assets TOTAL ASSETS LIABILITIES AND SHAREHOLDERS' EQUITY Current liabilities: Current portion of long-term debt Notes payable Accounts payable Current portion of operating lease liabilities Accrued liabilities Income taxes payable Total current liabilities Long-term debt Operating lease liabilities Deferred income taxes and other liabilities Commitments and contingencies (Note 18) Redeemable preferred stock Shareholders' equity: Common stock at stated value: Class A convertible - 315 and 315 shares outstanding Class B - 1,243 and 1,253 shares outstanding Capital in excess of stated value Accumulated other comprehensive income (loss) Retained earnings (deficit) Total shareholders' equity TOTAL LIABILITIES AND SHAREHOLDERS' EQUITY 6 9 2,612 3 $ 248 2.248 445 5,184 156 8,284 9.406 2.913 2,684 5,010 229 7,866 3,464 3,347 3 8,299 (56) (191) 8,055 31,342 S 3 7,163 231 1,643 9,040 23,717 $ The accompanying Notes to the Consolidated Financial Statements are an integral part of this statement. COMMON STOCK CAPITAL IN CLASS A CLASS B EXCESS OF STATED SHARES AMOUNT SHARES AMOUNT VALUE 329 $ 1,314 $ 3 $ 5,710 $ ACCUMULATED OTHER RETAINED COMPREHENSIVE EARNINGS INCOME (LOSS) (DEFICIT) TOTAL (213) $ 6,907 $ 12,407 600 24 600 (70) (254) (4,013) (4,267) (In millions, except per share data) Balance at May 31, 2017 Stock options exercised Repurchase of Class B Common Stock Dividends on common stock ($0.78 per share) and preferred stock ($0.10 per share) Issuance of shares to employees, net of shares withheld for employee taxes Stock-based compensation (1,265) (1,265) 4 110 (28) 82 218 218 Net income 1,933 1,933 104 104 17 (17) 329 $ 1,272 $ 3 $ 6,384 $ (92) $ 3,517 $ 9,812 18 539 539 14 Other comprehensive income (loss) Reclassifications to retained earnings in accordance with ASU 2018-02 Balance at May 31, 2018 Stock options exercised Conversion to Class B Common Stock Repurchase of Class B Common Stock Dividends on common stock ($0.86 per share) and preferred stock ($0.10 per share) Issuance of shares to employees, net of shares withheld for employee taxes Stock-based compensation (54) (227) (4,056) (4,283) (1,360) (1,360) 3 142 (3) 139 325 325 Net income 4,029 4,029 323 323 (507) (507) 23 23 315 $ 1,253 $ 3 $ 7,163 $ 231 $ 1,643 $ $ 9,040 20 703 703 Other comprehensive income (loss) Adoption of ASU 2016-16 (Note 1) Adoption of ASC Topic 606 (Note 1) Balance at May 31, 2019 Stock options exercised Repurchase of Class B Common Stock Dividends on common stock ($0.955 per share) and preferred stock ($0.10 per share) Issuance of shares to employees, net of shares withheld for employee taxes Stock-based compensation Net income (34) (161) (2,872) (3,033) (1,491) (1,491) 4 165 (9) 156 429 429 2,539 2,539 (287) (287) Other comprehensive income (loss) Adoption of ASC Topic 842 (Note 1) Balance at May 31, 2020 (1) (1) 315 $ 1,243 $ 3 $ 8,299 $ (56) $ (191) $ 8,055 CONSOLIDATED STATEMENTS OF CASH FLOWS YEAR ENDED MAY 31, 2019 2020 2018 $ 2,539 $ 4.029 $ 1,933 705 721 (380) 429 34 325 747 647 218 27 (99) 398 15 23 233 1,239 (1,854) (654) (270) (490) (203) 187 (255) 35 24 2,485 1,525 5,903 1,515 4,955 (Dollars in millions) Cash provided (used) by operations: Net income Adjustments to reconcile net income to net cash provided (used) by operations: Depreciation Deferred income taxes Stock-based compensation Amortization, impairment and other Net foreign currency adjustments Changes in certain working capital components and other assets and liabilities: (Increase) decrease in accounts receivable (Increase) decrease in inventories (Increase) decrease in prepaid expenses, operating lease right-of-use assets and other current and non-current assets Increase (decrease) in accounts payable, accrued liabilities, operating lease liabilities and other current and non-current liabilities Cash provided (used) by operations Cash provided (used) by investing activities: Purchases of short-term investments Maturities of short-term investments Sales of short-term investments Additions to property, plant and equipment Other investing activities Cash provided (used) by investing activities Cash provided (used) by financing activities: Proceeds from borrowings, net of debt issuance costs Increase (decrease) in notes payable, net Proceeds from exercise of stock options and other stock issuances Repurchase of common stock Dividends - common and preferred Other financing activities Cash provided (used) by financing activities Effect of exchange rate changes on cash and equivalents Net increase (decrease) in cash and equivalents Cash and equivalents, beginning of year CASH AND EQUIVALENTS, END OF YEAR Supplemental disclosure of cash flow information: Cash paid during the year for: Interest, net of capitalized interest Income taxes Non-cash additions to property, plant and equipment Dividends declared and not paid (2,426) 74 2,379 (1,086) 31 (1,028) (2,937) 1,715 2,072 (1,119) 5 (264) (4,783) 3,613 2,496 (1,028) (22) 276 6,134 49 885 (3,067) (1,452) (58) 2,491 (66) 3,882 4,466 8,348 $ (325) 700 (4,286) (1,332) (50) (5,293) (129) 217 4,249 4,466 $ 13 733 (4,254) (1,243) (84) (4,835) 45 441 3,808 4,249 S $ 125 140 $ 1,028 121 385 153 S 757 160 347 529 294 320 OPERATING OVERHEAD EXPENSE Operating overhead expense consists primarily of wage and benefit-related expenses, research and development costs, bad debt expense, as well as other administrative expenses, such as rent, depreciation and amortization, professional services, meetings and travel. CASH AND EQUIVALENTS Cash and equivalents represent cash and short-term, highly liquid investments, that are both readily convertible to known amounts of cash, and so near their maturity they present insignificant risk of changes in value because of changes in interest rates, including commercial paper, U.S. Treasury, U.S. Agency, money market funds, time deposits and corporate debt securities with maturities of 90 days or less at the date of purchase. SHORT-TERM INVESTMENTS Short-term investments consist of highly liquid investments, including commercial paper, U.S. Treasury, U.S. Agency, time deposits and corporate debt securities, with maturities over 90 days at the date of purchase. Debt securities the Company has the ability and positive intent to hold to maturity are carried at amortized cost. At May 31, 2020 and 2019, the Company did not hold any short-term investments classified as trading or held-to-maturity. At May 31, 2020 and 2019, Short-term investments consisted of available-for-sale debt securities, which are recorded at fair value with unrealized gains and losses reported, net of tax, in Accumulated other comprehensive income (loss), unless unrealized losses are determined to be other than temporary. Realized gains and losses on the sale of securities are determined by specific identification. The Company considers all available-for-sale debt securities, including those with maturity dates beyond 12 months, as available to support current operational liquidity needs and therefore, classifies all securities with maturity dates beyond 90 days at the date of purchase as current assets within Short-term investments on the Consolidated Balance Sheets. Refer to Note 6 - Fair Value Measurements for more information on the Company's short-term investments. ALLOWANCE FOR UNCOLLECTIBLE ACCOUNTS RECEIVABLE Accounts receivable, net consist primarily of amounts receivable from customers. The Company makes ongoing estimates relating to the collectability of its accounts receivable and maintains an allowance for estimated losses resulting from the inability of its customers to make required payments. In addition to judgments about the creditworthiness of significant customers based on ongoing credit evaluations, the Company considers historical levels of credit losses, as well as macroeconomic and industry trends, such as the impacts of COVID-19, to determine the amount of the allowance. Accounts receivable with anticipated collection dates greater than 12 months from the balance sheet date and related allowances are considered non-current and recorded in Deferred income taxes and other assets. The allowance for uncollectible accounts receivable was $214 million and $30 million as of May 31, 2020 and 2019, respectively. INVENTORY VALUATION Inventories are stated at lower of cost and net realizable value, and valued on either an average or a specific identification cost basis. In some instances, the Company ships product directly from its suppliers to the customer, with the related inventory and cost of sales recognized on a specific identification basis. Inventory costs primarily consist of product cost from the Company's suppliers, as well as inbound freight, import duties, taxes, insurance and logistics and other handling fees. PROPERTY, PLANT AND EQUIPMENT AND DEPRECIATION Property, plant and equipment are recorded at cost. Depreciation is determined on a straight-line basis for land improvements, buildings and leasehold improvements over 2 to 40 years and for machinery and equipment over 2 to 15 years. Depreciation and amortization of assets used in manufacturing, warehousing and product distribution are recorded in Cost of sales. Depreciation and amortization of all other assets are recorded in Operating overhead expense. At the most recent balance sheet date, the historical cost of the company's property, plant and equipment was (in millions): O a. $4,866. O b. $4,795. O c. $4.725. O d. $9,661. At the most recent balance sheet date, the book value of Nike's property, plant and equipment was (in millions): O a. $4,866. b.$4,795. O c. $4,725. O d. $9,661. At the most recent balance sheet date, total depreciation expense recognized by Nike on property, plant and equipment since the assets were acquired was (in millions): O a. $4,866. O b. $4,795. O c. $4,725. O d. $9,661. Nike's depreciation method results in depreciation methods. book value being reported on the company's balance sheet early in an asset's useful life than compared to the accelerated O a more O b. less O c. the same
Step by Step Solution
There are 3 Steps involved in it

Get step-by-step solutions from verified subject matter experts