

Question: Financial Statements from problem 1: Exhibit 3-6, page 99: Copy the Big Rock Candy Mountain Mining financial statements from Problem 1 in Chapter 2 into
Financial Statements from problem 1:
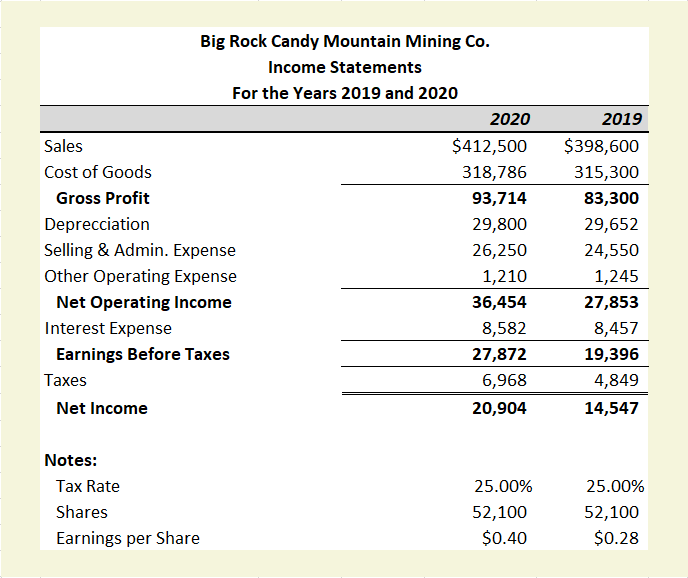
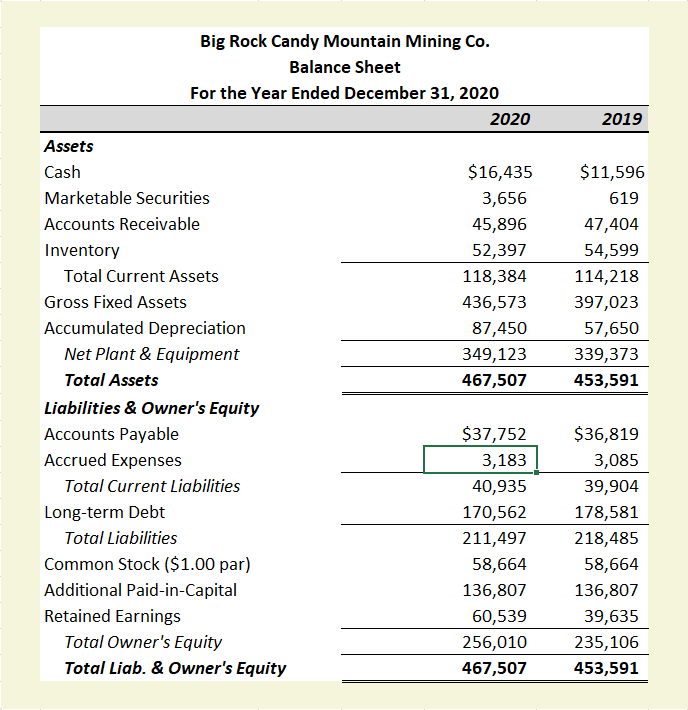
Exhibit 3-6, page 99:
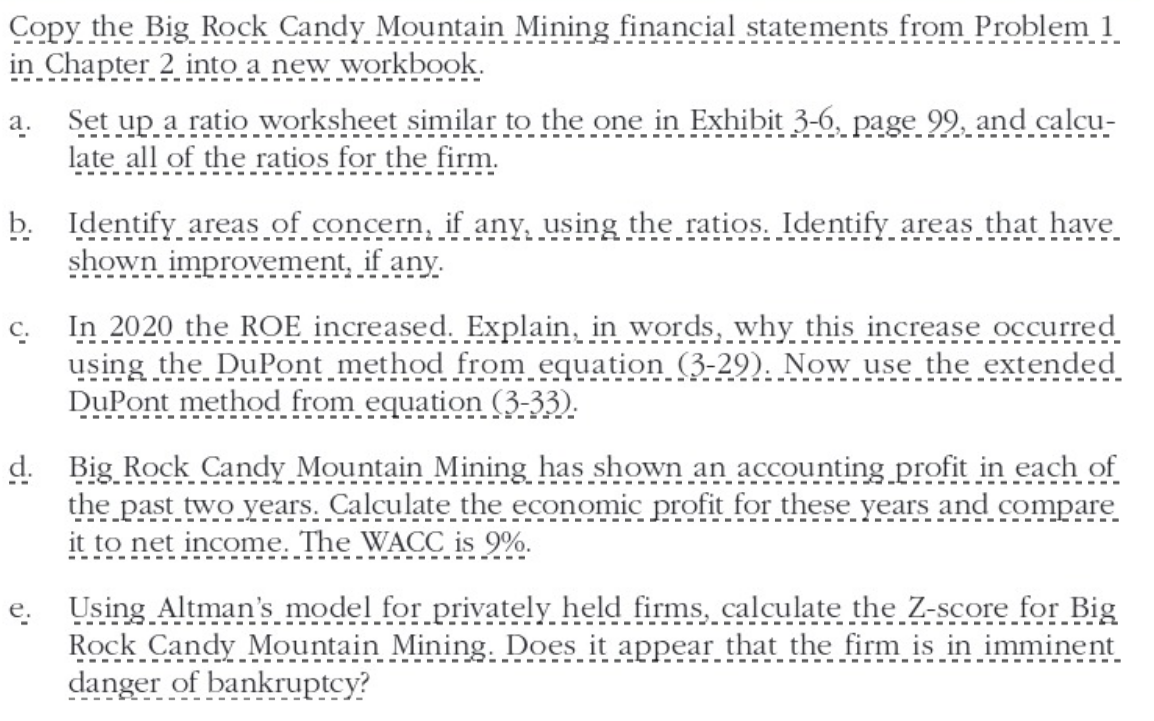
Copy the Big Rock Candy Mountain Mining financial statements from Problem 1 in Chapter 2 into a new workbook. a. Set up a ratio worksheet similar to the one in Exhibit 3-6, page 99, and calcu- late all of the ratios for the firm. b. Identify areas of concern, if any, using the ratios. Identify areas that have shown improvement, if any. c. In 2020 the ROE increased. Explain, in words, why this increase occurred using the DuPont method from equation (3-29). Now use the extended DuPont method from equation (3-33). d. Big Rock Candy Mountain Mining has shown an accounting profit in each of the past two years. Calculate the economic profit for these years and compare it to net income. The WACC is 9%. e. Using Altman's model for privately held firms, calculate the Z-score for Big Rock Candy Mountain Mining: Does it appear that the firm is in imminent danger of bankruptcy? Big Rock Candy Mountain Mining Co. Income Statements For the Years 2019 and 2020 2020 Sales $412,500 Cost of Goods 318,786 Gross Profit 93,714 Deprecciation 29,800 Selling & Admin. Expense 26,250 Other Operating Expense 1,210 Net Operating Income 36,454 Interest Expense 8,582 Earnings Before Taxes 27,872 Taxes 6,968 Net Income 20,904 2019 $398,600 315,300 83,300 29,652 24,550 1,245 27,853 8,457 19,396 4,849 14,547 Notes: Tax Rate Shares Earnings per Share 25.00% 52,100 $0.40 25.00% 52,100 $0.28 2019 Big Rock Candy Mountain Mining Co. Balance Sheet For the Year Ended December 31, 2020 2020 Assets Cash $16,435 Marketable Securities 3,656 Accounts Receivable 45,896 Inventory 52,397 Total Current Assets 118,384 Gross Fixed Assets 436,573 Accumulated Depreciation 87,450 Net Plant & Equipment 349,123 Total Assets 467,507 Liabilities & Owner's Equity Accounts Payable $37,752 Accrued Expenses 3,183 Total Current Liabilities 40,935 Long-term Debt 170,562 Total Liabilities 211,497 Common Stock ($1.00 par) 58,664 Additional Paid-in-Capital 136,807 Retained Earnings 60,539 Total Owner's Equity 256,010 Total Liab. & Owner's Equity 467,507 $11,596 619 47,404 54,599 114,218 397,023 57,650 339,373 453,591 $36,819 3,085 39,904 178,581 218,485 58,664 136,807 39,635 235,106 453,591 A D 1 B Elvis Products International Ratio Analysis for 2019 and 2020 N Industry 2020 2.70x 1.00x 7.00x 10.70x 33.64 days 11.20x 2.60x 3 Ratio 2020 2019 4 Liquidity Ratios 5 Current Ratio 2.39x 2.33x 6 Quick Ratio 0.84x 0.85x 7 Efficiency Ratios 8 Inventory Turnover 3.89x 4.00x 9 A/R Turnover 9.58x 9.77x 10 Average Collection Period 37.59 days 36.84 days 11 Fixed Asset Turnover 10.67x 9.95x 12 Total Asset Turnover 2.33x 2.34x 13 Leverage Ratios 14 Total Debt Ratio 58.45% 54.81% 15 Long-term Debt Ratio 25.72% 22.02% 16 LTD to Total Capitalization 38.23% 32.76% 17 Debt to Equity 1.41x 1.2 1x 18 LTD to Equity 61.90% 48.73% 19 Coverage Ratios 20 Times Interest Earned 1.97x 3.35x 21 Cash Coverage Ratio 2.23x 3.65x 22 Profitability Ratios 23 Gross Profit Margin 15.58% 16.55% 24 Operating Profit Margin 3.89% 6.09% 25 Net Profit Margin 1.44% 3.20% 26 Return on Total Assets 3.35% 7.49% 27 Return on Equity 8.06% 16.56% 28 Return on Common Equity 8.06% 16.56% 50.00% 20.00% 28.57% 1.00x 40.00% 2.50x 2.80x 17.50% 6.25% 3.50% 9.10% 18.20% 18.20% Copy the Big Rock Candy Mountain Mining financial statements from Problem 1 in Chapter 2 into a new workbook. a. Set up a ratio worksheet similar to the one in Exhibit 3-6, page 99, and calcu- late all of the ratios for the firm. b. Identify areas of concern, if any, using the ratios. Identify areas that have shown improvement, if any. c. In 2020 the ROE increased. Explain, in words, why this increase occurred using the DuPont method from equation (3-29). Now use the extended DuPont method from equation (3-33). d. Big Rock Candy Mountain Mining has shown an accounting profit in each of the past two years. Calculate the economic profit for these years and compare it to net income. The WACC is 9%. e. Using Altman's model for privately held firms, calculate the Z-score for Big Rock Candy Mountain Mining: Does it appear that the firm is in imminent danger of bankruptcy? Big Rock Candy Mountain Mining Co. Income Statements For the Years 2019 and 2020 2020 Sales $412,500 Cost of Goods 318,786 Gross Profit 93,714 Deprecciation 29,800 Selling & Admin. Expense 26,250 Other Operating Expense 1,210 Net Operating Income 36,454 Interest Expense 8,582 Earnings Before Taxes 27,872 Taxes 6,968 Net Income 20,904 2019 $398,600 315,300 83,300 29,652 24,550 1,245 27,853 8,457 19,396 4,849 14,547 Notes: Tax Rate Shares Earnings per Share 25.00% 52,100 $0.40 25.00% 52,100 $0.28 2019 Big Rock Candy Mountain Mining Co. Balance Sheet For the Year Ended December 31, 2020 2020 Assets Cash $16,435 Marketable Securities 3,656 Accounts Receivable 45,896 Inventory 52,397 Total Current Assets 118,384 Gross Fixed Assets 436,573 Accumulated Depreciation 87,450 Net Plant & Equipment 349,123 Total Assets 467,507 Liabilities & Owner's Equity Accounts Payable $37,752 Accrued Expenses 3,183 Total Current Liabilities 40,935 Long-term Debt 170,562 Total Liabilities 211,497 Common Stock ($1.00 par) 58,664 Additional Paid-in-Capital 136,807 Retained Earnings 60,539 Total Owner's Equity 256,010 Total Liab. & Owner's Equity 467,507 $11,596 619 47,404 54,599 114,218 397,023 57,650 339,373 453,591 $36,819 3,085 39,904 178,581 218,485 58,664 136,807 39,635 235,106 453,591 A D 1 B Elvis Products International Ratio Analysis for 2019 and 2020 N Industry 2020 2.70x 1.00x 7.00x 10.70x 33.64 days 11.20x 2.60x 3 Ratio 2020 2019 4 Liquidity Ratios 5 Current Ratio 2.39x 2.33x 6 Quick Ratio 0.84x 0.85x 7 Efficiency Ratios 8 Inventory Turnover 3.89x 4.00x 9 A/R Turnover 9.58x 9.77x 10 Average Collection Period 37.59 days 36.84 days 11 Fixed Asset Turnover 10.67x 9.95x 12 Total Asset Turnover 2.33x 2.34x 13 Leverage Ratios 14 Total Debt Ratio 58.45% 54.81% 15 Long-term Debt Ratio 25.72% 22.02% 16 LTD to Total Capitalization 38.23% 32.76% 17 Debt to Equity 1.41x 1.2 1x 18 LTD to Equity 61.90% 48.73% 19 Coverage Ratios 20 Times Interest Earned 1.97x 3.35x 21 Cash Coverage Ratio 2.23x 3.65x 22 Profitability Ratios 23 Gross Profit Margin 15.58% 16.55% 24 Operating Profit Margin 3.89% 6.09% 25 Net Profit Margin 1.44% 3.20% 26 Return on Total Assets 3.35% 7.49% 27 Return on Equity 8.06% 16.56% 28 Return on Common Equity 8.06% 16.56% 50.00% 20.00% 28.57% 1.00x 40.00% 2.50x 2.80x 17.50% 6.25% 3.50% 9.10% 18.20% 18.20%
Step by Step Solution
There are 3 Steps involved in it

Get step-by-step solutions from verified subject matter experts