

Question: find: null & alternative hypothesis, test statistic, p-value/critical region, decision about null hypothesis, and conclusion Ex: A professor at a large community college wanted to
find: null & alternative hypothesis, test statistic, p-value/critical region, decision about null hypothesis, and conclusion
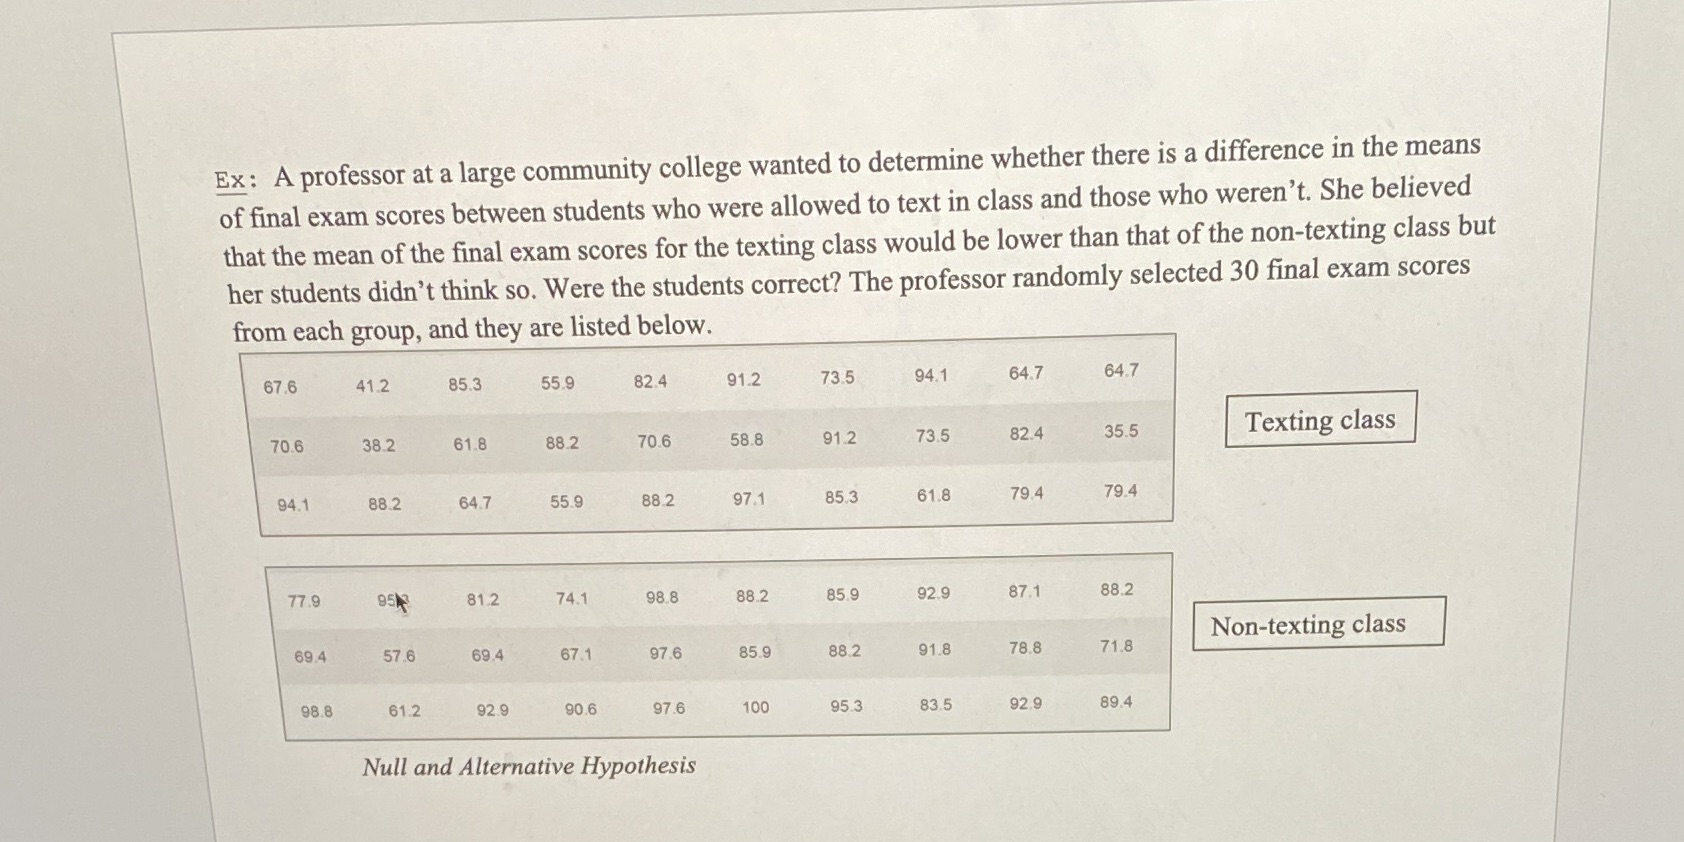
Ex: A professor at a large community college wanted to determine whether there is a difference in the means of final exam scores between students who were allowed to text in class and those who weren't. She believed that the mean of the final exam scores for the texting class would be lower than that of the non-texting class but her students didn't think so. Were the students correct? The professor randomly selected 30 final exam scores from each group, and they are listed below. 67.6 41.2 85.3 55.9 82.4 91.2 73.5 94.1 64.7 64.7 70.6 38.2 61.8 88.2 70.6 58.8 91.2 73.5 82.4 35.5 Texting class 94.1 88.2 64.7 55.9 88.2 97.1 85.3 61.8 79.4 79.4 77.9 9513 81.2 74.1 98.8 88.2 85.9 92.9 87.1 88.2 69.4 57.6 69.4 67.1 97.6 85.9 88.2 Non-texting class 91.8 78.8 71.8 98.8 61.2 92.9 90.6 97.6 100 95.3 83.5 92.9 89.4 Null and Alternative Hypothesis
Step by Step Solution
There are 3 Steps involved in it

Get step-by-step solutions from verified subject matter experts