

Question: Find the best values for alpha that you can. How did you do it? How would you characterize this demand pattern? i.e. what patterns do
Find the best values for alpha that you can. How did you do it?
How would you characterize this demand pattern? i.e. what patterns do you see?
Given your answer to the one above, which method would you expect to do a better job than Exponential Smoothing?
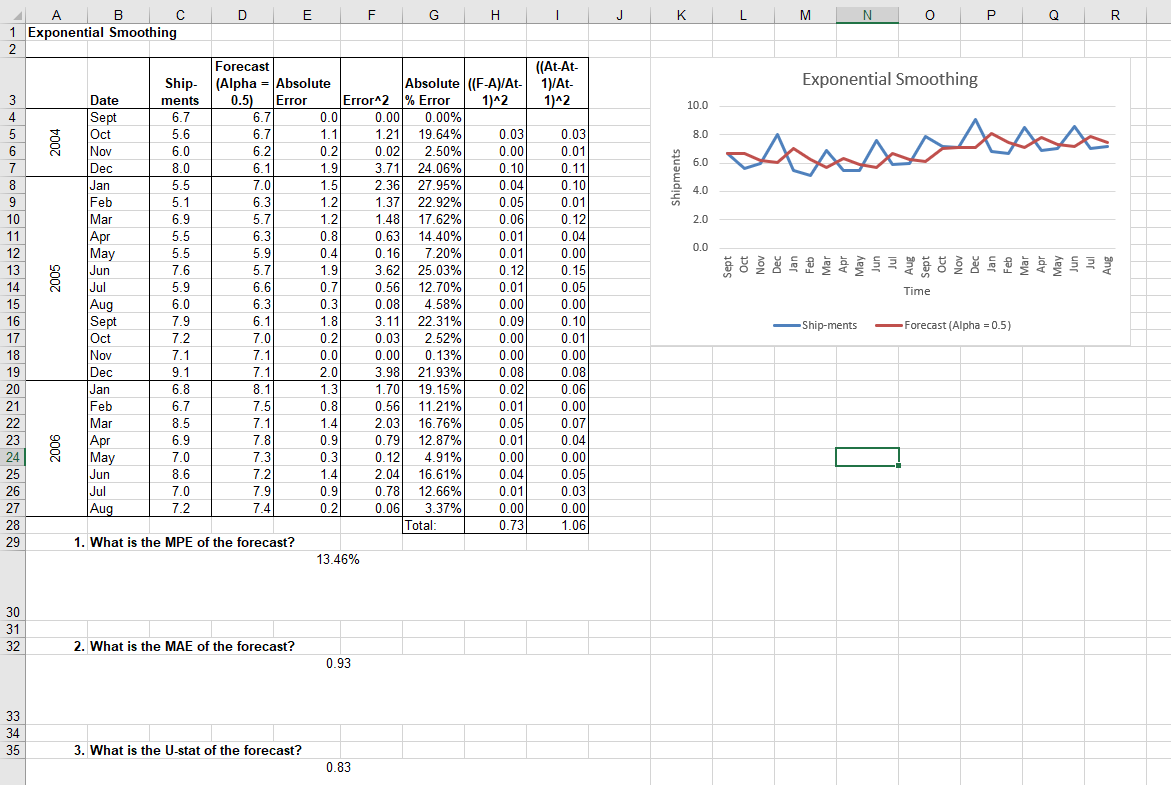
G J K L M N O Q R Exponential Smoothing 10.0 8.0 2004 styl 6.0 AA Shipments 6.1 4.0 2.0 0.0 B D E F H 1 1 Exponential Smoothing 2 Forecast ((At-At- Ship- (Alpha (Alpha - Absolute = Absolute ((F-A)/At- 1)/At- 3 Date ments 0.5) Error Error^2 % Error 1)^2 1)^2 4 Sept 6.7 6.7 0.0 0.001 0.00% 5 Oct 5.6 6.7 1.1 1.21 19.64% 0.03 0.03 6 Nov 6.0 6.2 0.2 0.02 2.50% 0.00 0.01 7 Dec 8.0 1.9 3.71 24.06% 0.10 0.11 8 Jan 5.5 7.0 1.5 2.36 27.95% 0.04 0.10 9 Feb 5.1 6.3 1.2 1.37 22.92% 0.05 0.01 10 Mar 6.9 5.7 1.2 1.48 17.62% 0.06 0.12 11 Apr 5.5 6.3 0.8 0.63 14.40% 0.01 0.04 12 May 5.5 5.9 0.4 0.16 7.20% 0.01 0.00 13 Jun 7.6 5.7 1.9 3.62 25.03% 0.12 0.15 14 Jul 5.9 6.6 0.7 0.56 12.70% 0.01 0.05 15 Aug 6.0 6.3 0.3 0.08 4.58% 0.00 0.00 16 Sept 7.9 6.1 1.8 3.11 22.31% 0.09 0.10 17 Oct 7.2 7.0 0.2 0.03 2.52% 0.00 0.01 18 Nov 7.1 7.1 0.0 0.00 0.13% 0.00 0.00 19 Dec 9.1 7.1 2.0 3.98 21.93% 0.08 0.08 20 Jan 6.8 8.1 1.3 1.701 19.15% 0.02 0.06 21 Feb 6.7 7.5 0.8 0.56) 11.21% 0.01 0.00 22 Mar 8.5 7.1 1.4 2.03 16.76% 0.05 0.07 23 Apr 7.8 0.9 0.791 12.87% 0.01 0.04 24 May 7.0 7.3 0.3 0.12 4.91% 0.00 0.00 25 Jun 8.6 7.2. 1.4 2.04 16.61% 0.04 0.05 26 Jul 7.0 7.9 0.9 0.78 12.66% 0.01 0.03 27 Aug 7.2 7.4 0.2 0.06 3.37% 0.00 0.00 28 Total: 0.73 1.06 29 1. What is the MPE of the forecast? 13.46% 2005 Time -Ship-ments - -Forecast (Alpha=0.5) 6.9 2006 30 31 32 2. What is the MAE of the forecast? 0.93 33 34 35 3. What is the U-stat of the forecast? 0.83Step by Step Solution
There are 3 Steps involved in it
1 Expert Approved Answer
Step: 1 Unlock

Question Has Been Solved by an Expert!
Get step-by-step solutions from verified subject matter experts
Step: 2 Unlock
Step: 3 Unlock