

Question: Find the COV (Coefficient of Value) for each Regression chart Regression 1 Regression 2 Descriptive Statistics Descriptive Statistics Mean Std. Deviation N Mean Std. Deviation
Find the COV (Coefficient of Value) for each Regression chart
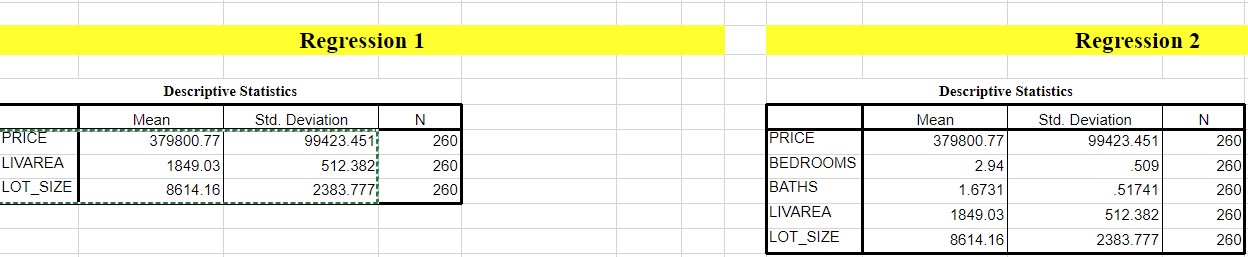
Regression 1 Regression 2 Descriptive Statistics Descriptive Statistics Mean Std. Deviation N Mean Std. Deviation N PRICE 379800.77 99423.451: 260 PRICE 379800.77 99423.451 260 LIVAREA 1849.03 512.382; 260 BEDROOMS 2.94 509 260 LOT SIZE 8614.16 2383.777 260 BATHS 1.6731 51741 260 LIVAREA 1849.03 512.382 260 LOT_SIZE 8614.16 2383.777 260
Step by Step Solution
There are 3 Steps involved in it
1 Expert Approved Answer
Step: 1 Unlock

Question Has Been Solved by an Expert!
Get step-by-step solutions from verified subject matter experts
Step: 2 Unlock
Step: 3 Unlock