

Question: Find the following using the information provided. Show work if possible! Thank You! Ar 24, 2018 C $ 1 2300 14 11 E HT HOE
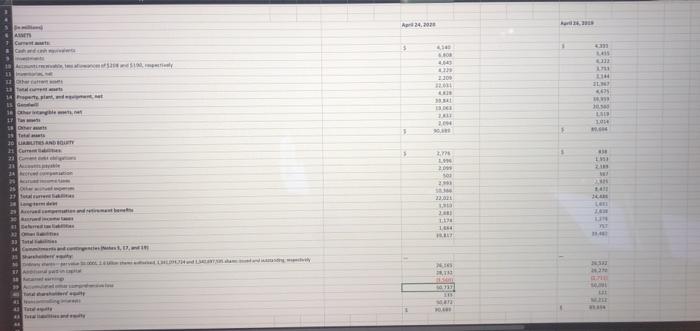
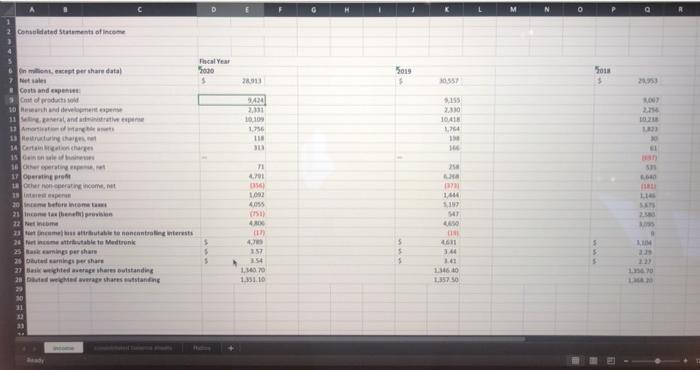
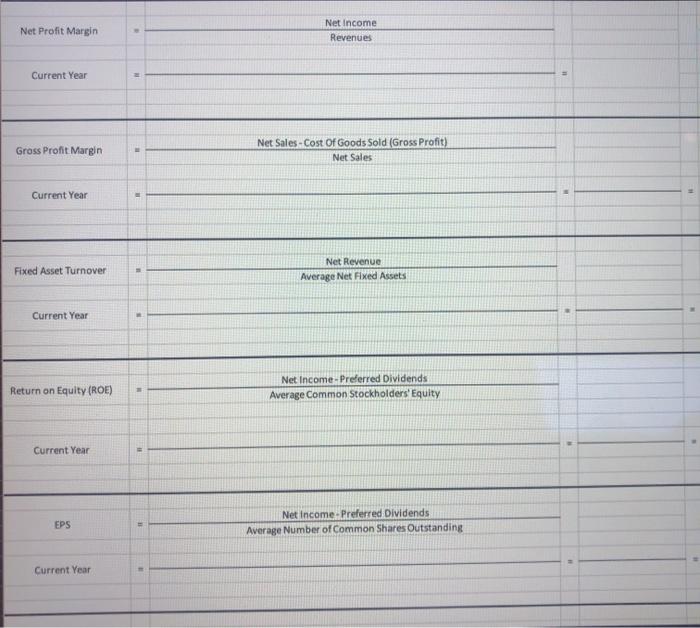
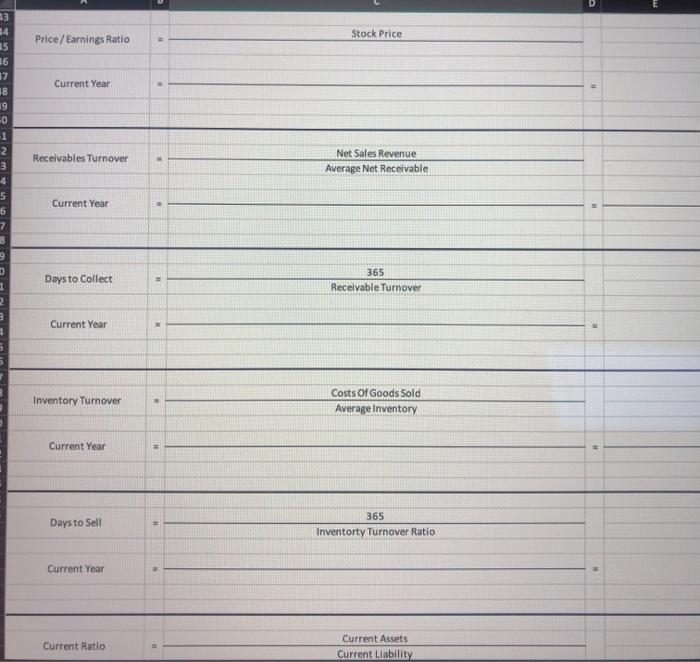
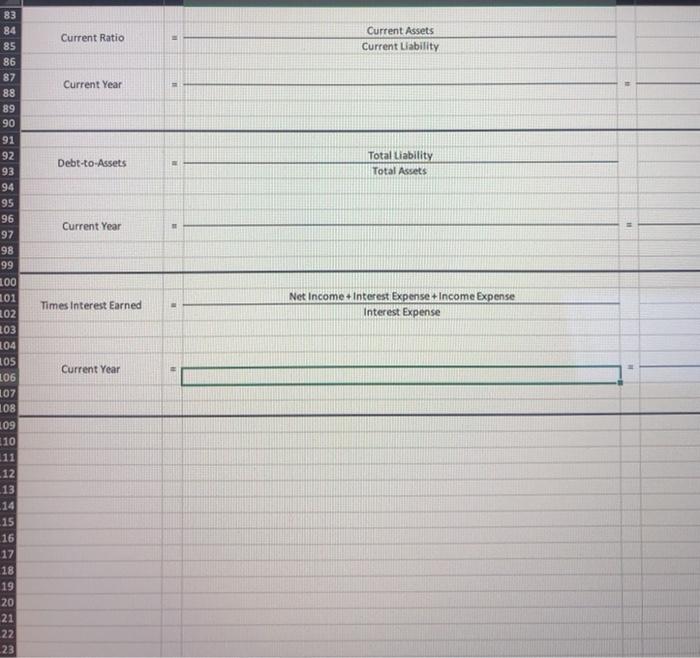
Ar 24, 2018 C $ 1 2300 14 11 E HT HOE Der 30 LAUSANBEUT C 3 FT VE 2 24 20 as 22 teater 2 HIPE 23 1 LEE am UN LIM 1 14 17. 37 Ant CH DEERE CEED LE TE Consolidated Statements of income cal Year 5000 5 5019 5018 $ 2013 30.357 23 3424 2,131 10.109 17 STS DELE 141 11 13 T 4. 38 60 HE Unione per share data Net Costs and expen Citrus 10 Berhad bewerter 11 tanti Amarang 13 ore 14 har 15 16 Operating 17 Operating po Othering com, pen 20 Betrico 21 incombeni 22 cm 11 ngy thng | huum airluut atu tu nhien trung terest 25 metr te Medtronk 25 Baskemings per share 21 Date ai pershane 27 Buched were there outstanding 21 dich were shares standing 23 30 31 2 100 4,055 1,464 19 HT 4 4. HY $ 1 $ 09 611 34 1 1.146.30 LIST 2.1 $ 5 154 1.14 1.351.10 113610 Net Profit Margin Net Income Revenues Current Year Gross Profit Margin Net Sales - Cost Of Goods Sold (Gross Profit) Net Sales Current Year Fixed Asset Turnover Net Revenue Average Net Fixed Assets Current Year Return on Equity (ROE) Net Income-Preferred Dividends Average Common Stockholders' Equity Current Year EPS Net Income-Preferred Dividends Average Number of Common Shares Outstanding Current Year Stock Price Price/Earnings Ratio Current Year 13 24 15 16 17 18 9 -0 1 2 3 4 5 6 7 3 Receivables Turnover Net Sales Revenue Average Net Receivable Current Year 9 D Days to Collect 365 Receivable Turnover 2 Current Year Inventory Turnover Costs Of Goods Sold Average Inventory Current Year Days to Sell 365 Inventorty Turnover Ratio Current Year Current Ratio Current Assets Current Liability Current Ratio Current Assets Current Liability Current Year 83 84 85 86 87 88 89 90 91 92 93 94 95 96 97 98 99 Debt-to-Assets Total Liability Total Assets Current Year 100 201 Times Interest Earned Net Income Interest Expense Income Expense Interest Expense 202 203 Current Year 104 LOS 106 107 108 109 110 311 12 13 14 15 16 17 18 19 20 21 22 23 Ar 24, 2018 C $ 1 2300 14 11 E HT HOE Der 30 LAUSANBEUT C 3 FT VE 2 24 20 as 22 teater 2 HIPE 23 1 LEE am UN LIM 1 14 17. 37 Ant CH DEERE CEED LE TE Consolidated Statements of income cal Year 5000 5 5019 5018 $ 2013 30.357 23 3424 2,131 10.109 17 STS DELE 141 11 13 T 4. 38 60 HE Unione per share data Net Costs and expen Citrus 10 Berhad bewerter 11 tanti Amarang 13 ore 14 har 15 16 Operating 17 Operating po Othering com, pen 20 Betrico 21 incombeni 22 cm 11 ngy thng | huum airluut atu tu nhien trung terest 25 metr te Medtronk 25 Baskemings per share 21 Date ai pershane 27 Buched were there outstanding 21 dich were shares standing 23 30 31 2 100 4,055 1,464 19 HT 4 4. HY $ 1 $ 09 611 34 1 1.146.30 LIST 2.1 $ 5 154 1.14 1.351.10 113610 Net Profit Margin Net Income Revenues Current Year Gross Profit Margin Net Sales - Cost Of Goods Sold (Gross Profit) Net Sales Current Year Fixed Asset Turnover Net Revenue Average Net Fixed Assets Current Year Return on Equity (ROE) Net Income-Preferred Dividends Average Common Stockholders' Equity Current Year EPS Net Income-Preferred Dividends Average Number of Common Shares Outstanding Current Year Stock Price Price/Earnings Ratio Current Year 13 24 15 16 17 18 9 -0 1 2 3 4 5 6 7 3 Receivables Turnover Net Sales Revenue Average Net Receivable Current Year 9 D Days to Collect 365 Receivable Turnover 2 Current Year Inventory Turnover Costs Of Goods Sold Average Inventory Current Year Days to Sell 365 Inventorty Turnover Ratio Current Year Current Ratio Current Assets Current Liability Current Ratio Current Assets Current Liability Current Year 83 84 85 86 87 88 89 90 91 92 93 94 95 96 97 98 99 Debt-to-Assets Total Liability Total Assets Current Year 100 201 Times Interest Earned Net Income Interest Expense Income Expense Interest Expense 202 203 Current Year 104 LOS 106 107 108 109 110 311 12 13 14 15 16 17 18 19 20 21 22 23
Step by Step Solution
There are 3 Steps involved in it

Get step-by-step solutions from verified subject matter experts