

Question: Find the indicated probability and interpret the result. From 1975 through 2020, the mean annual gain of the Dow Jones Industrial Average was 653.
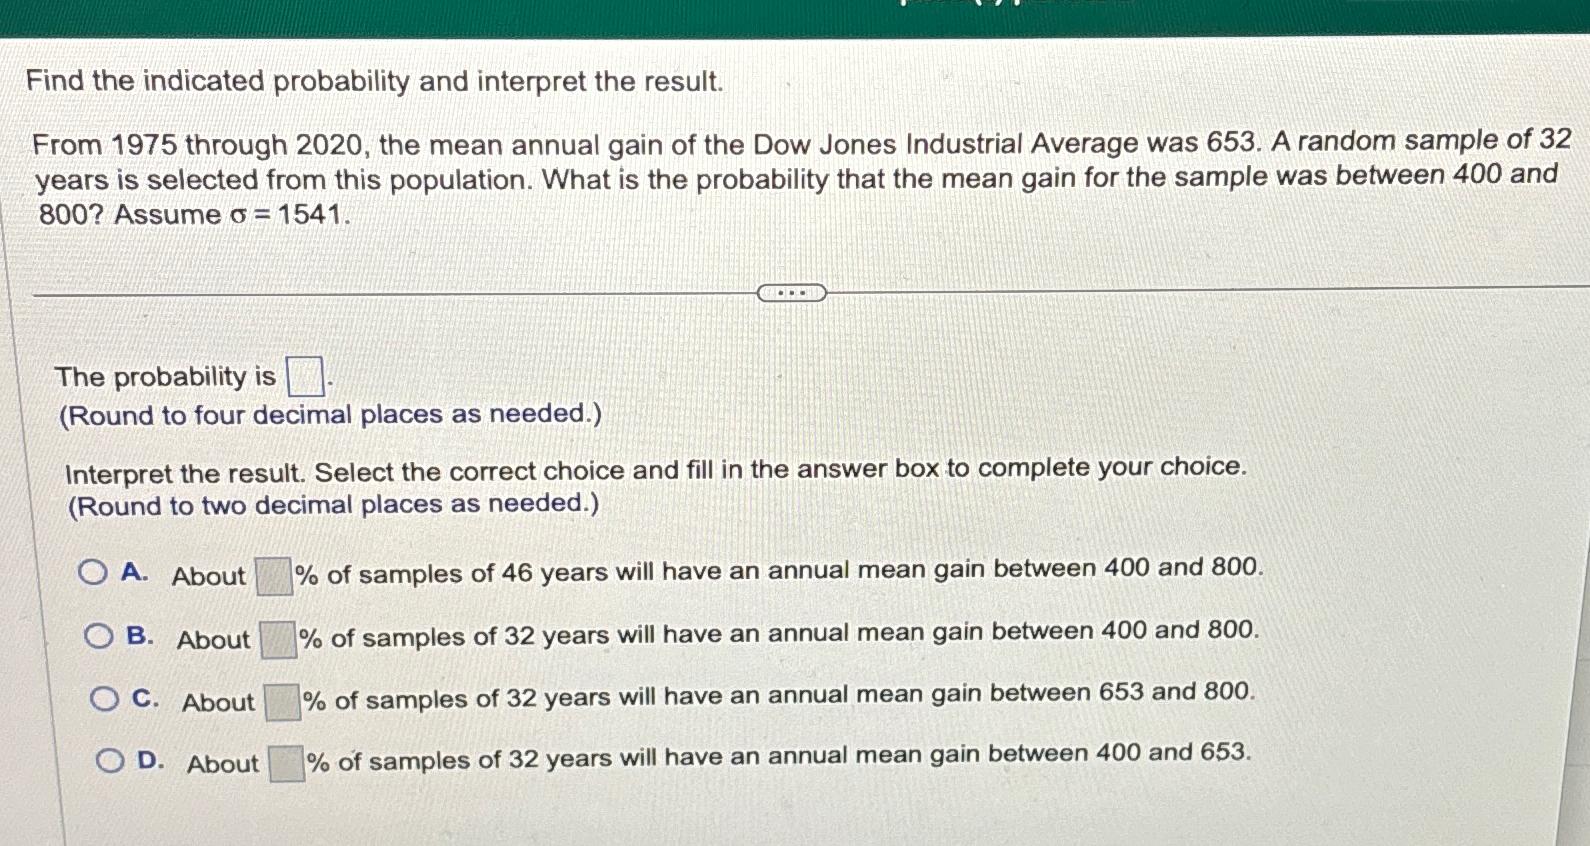
Find the indicated probability and interpret the result. From 1975 through 2020, the mean annual gain of the Dow Jones Industrial Average was 653. A random sample of 32 years is selected from this population. What is the probability that the mean gain for the sample was between 400 and 800? Assume o = 1541. The probability is (Round to four decimal places as needed.) Interpret the result. Select the correct choice and fill in the answer box to complete your choice. (Round to two decimal places as needed.) OA. About OB. About OC. About OD. About % of samples of 46 years will have an annual mean gain between 400 and 800. % of samples of 32 years will have an annual mean gain between 400 and 800. % of samples of 32 years will have an annual mean gain between 653 and 800. % of samples of 32 years will have an annual mean gain between 400 and 653.
Step by Step Solution
There are 3 Steps involved in it

Get step-by-step solutions from verified subject matter experts