

Question: find the mean and also the standard deviation for the first question please. W . . . . . . . . . . :I
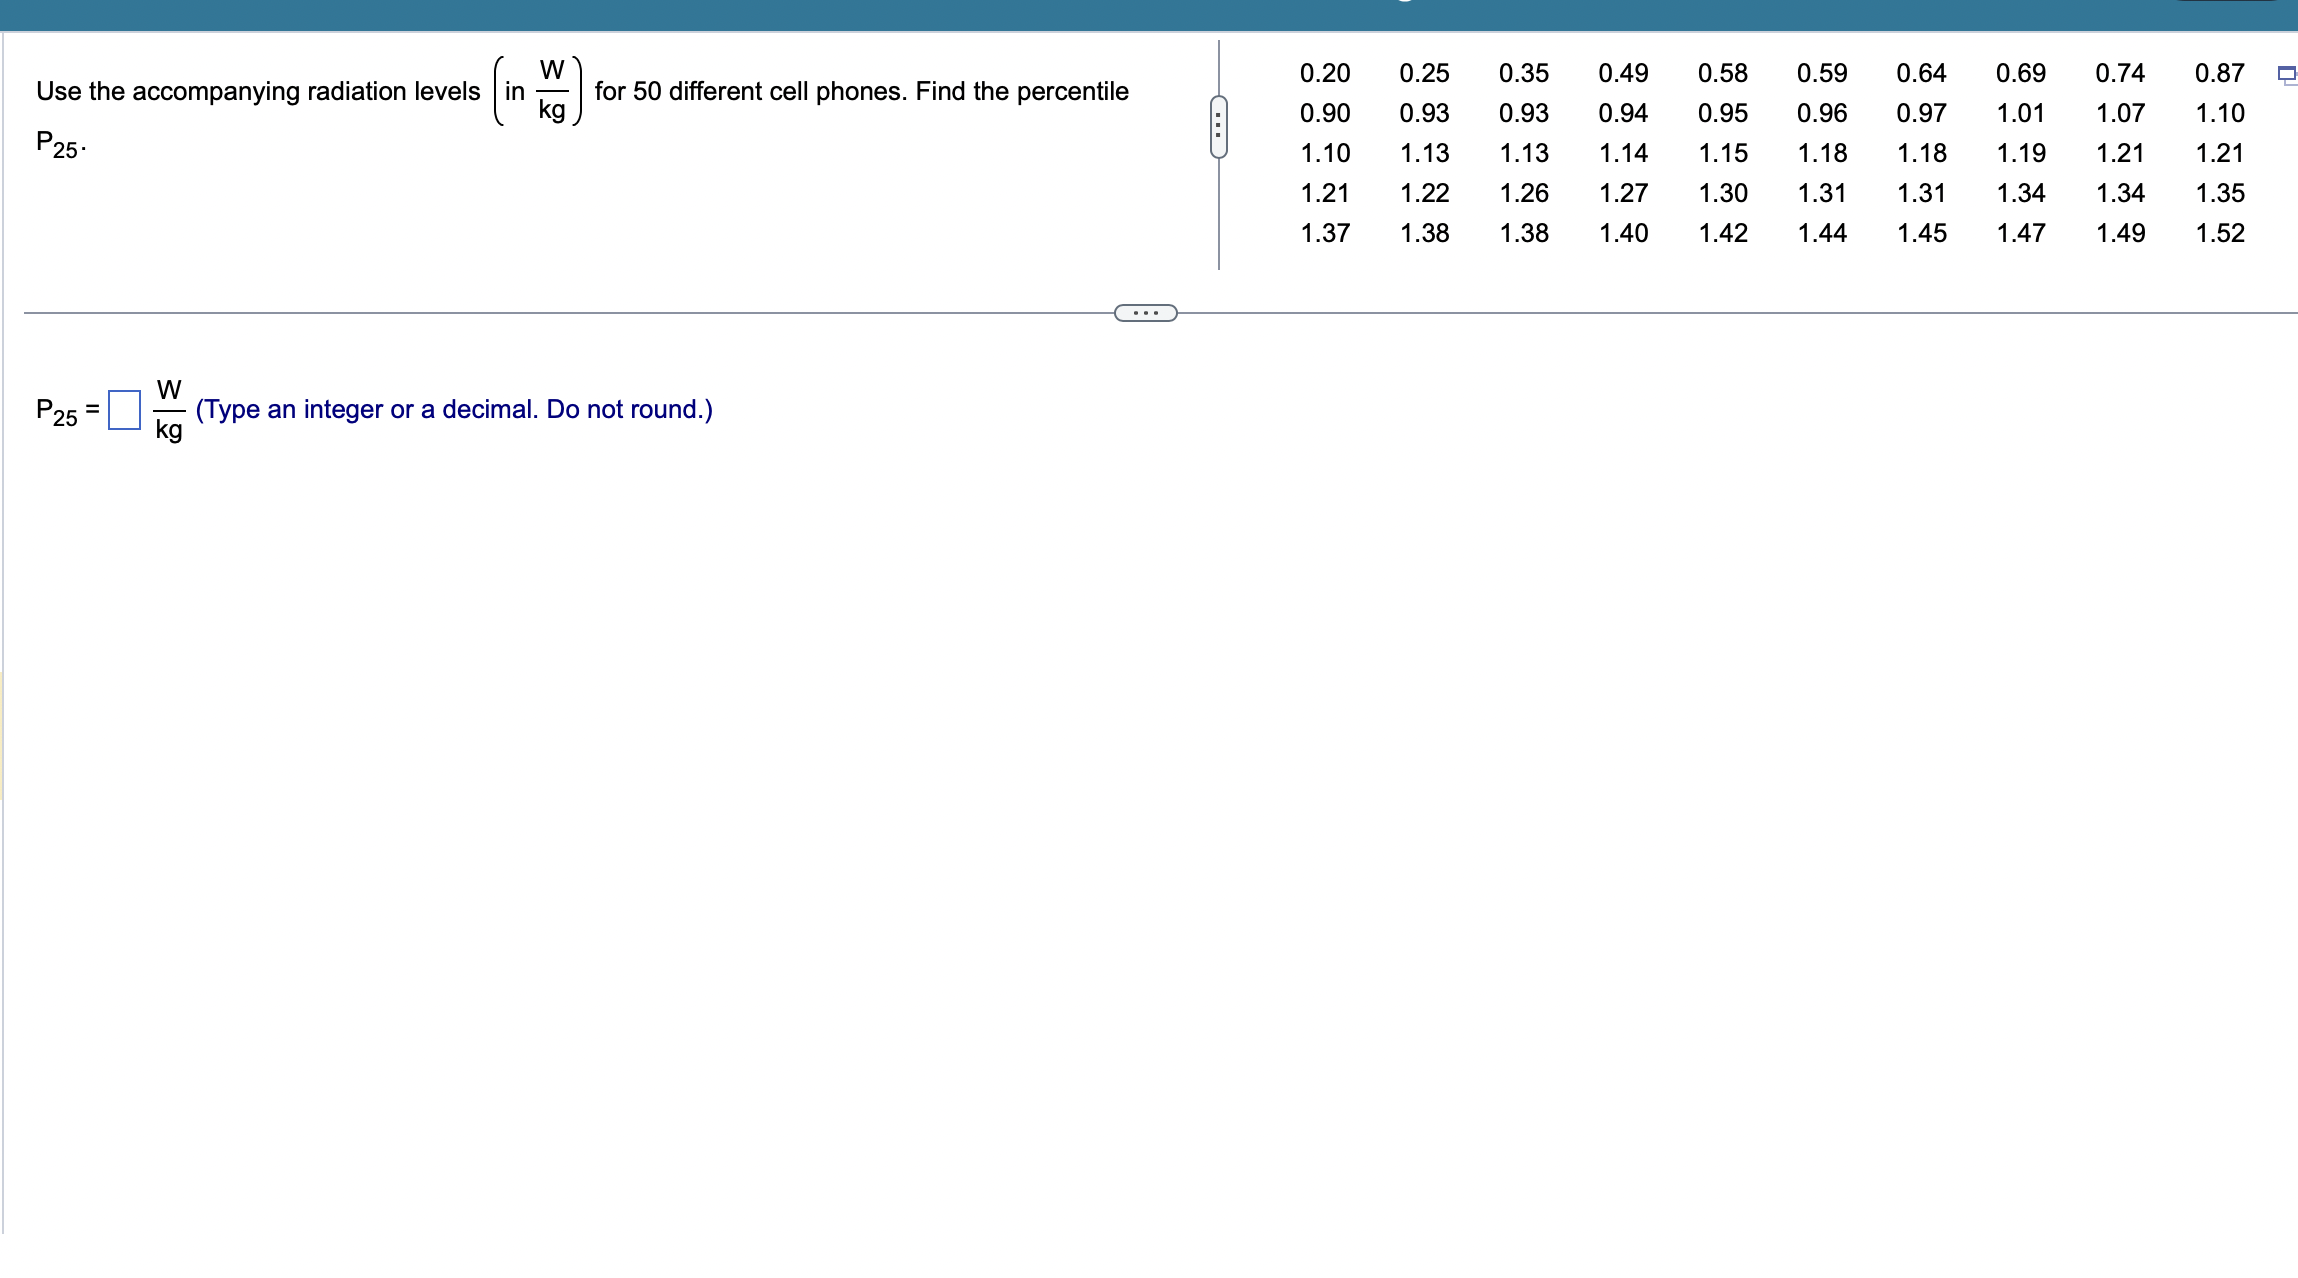
find the mean and also the standard deviation for the first question please.
![:I Use the accompanying radiation levels [in ] for 50 different cell](https://dsd5zvtm8ll6.cloudfront.net/si.experts.images/questions/2024/11/672bcb0d81969_277672bcb0d443d2.jpg)
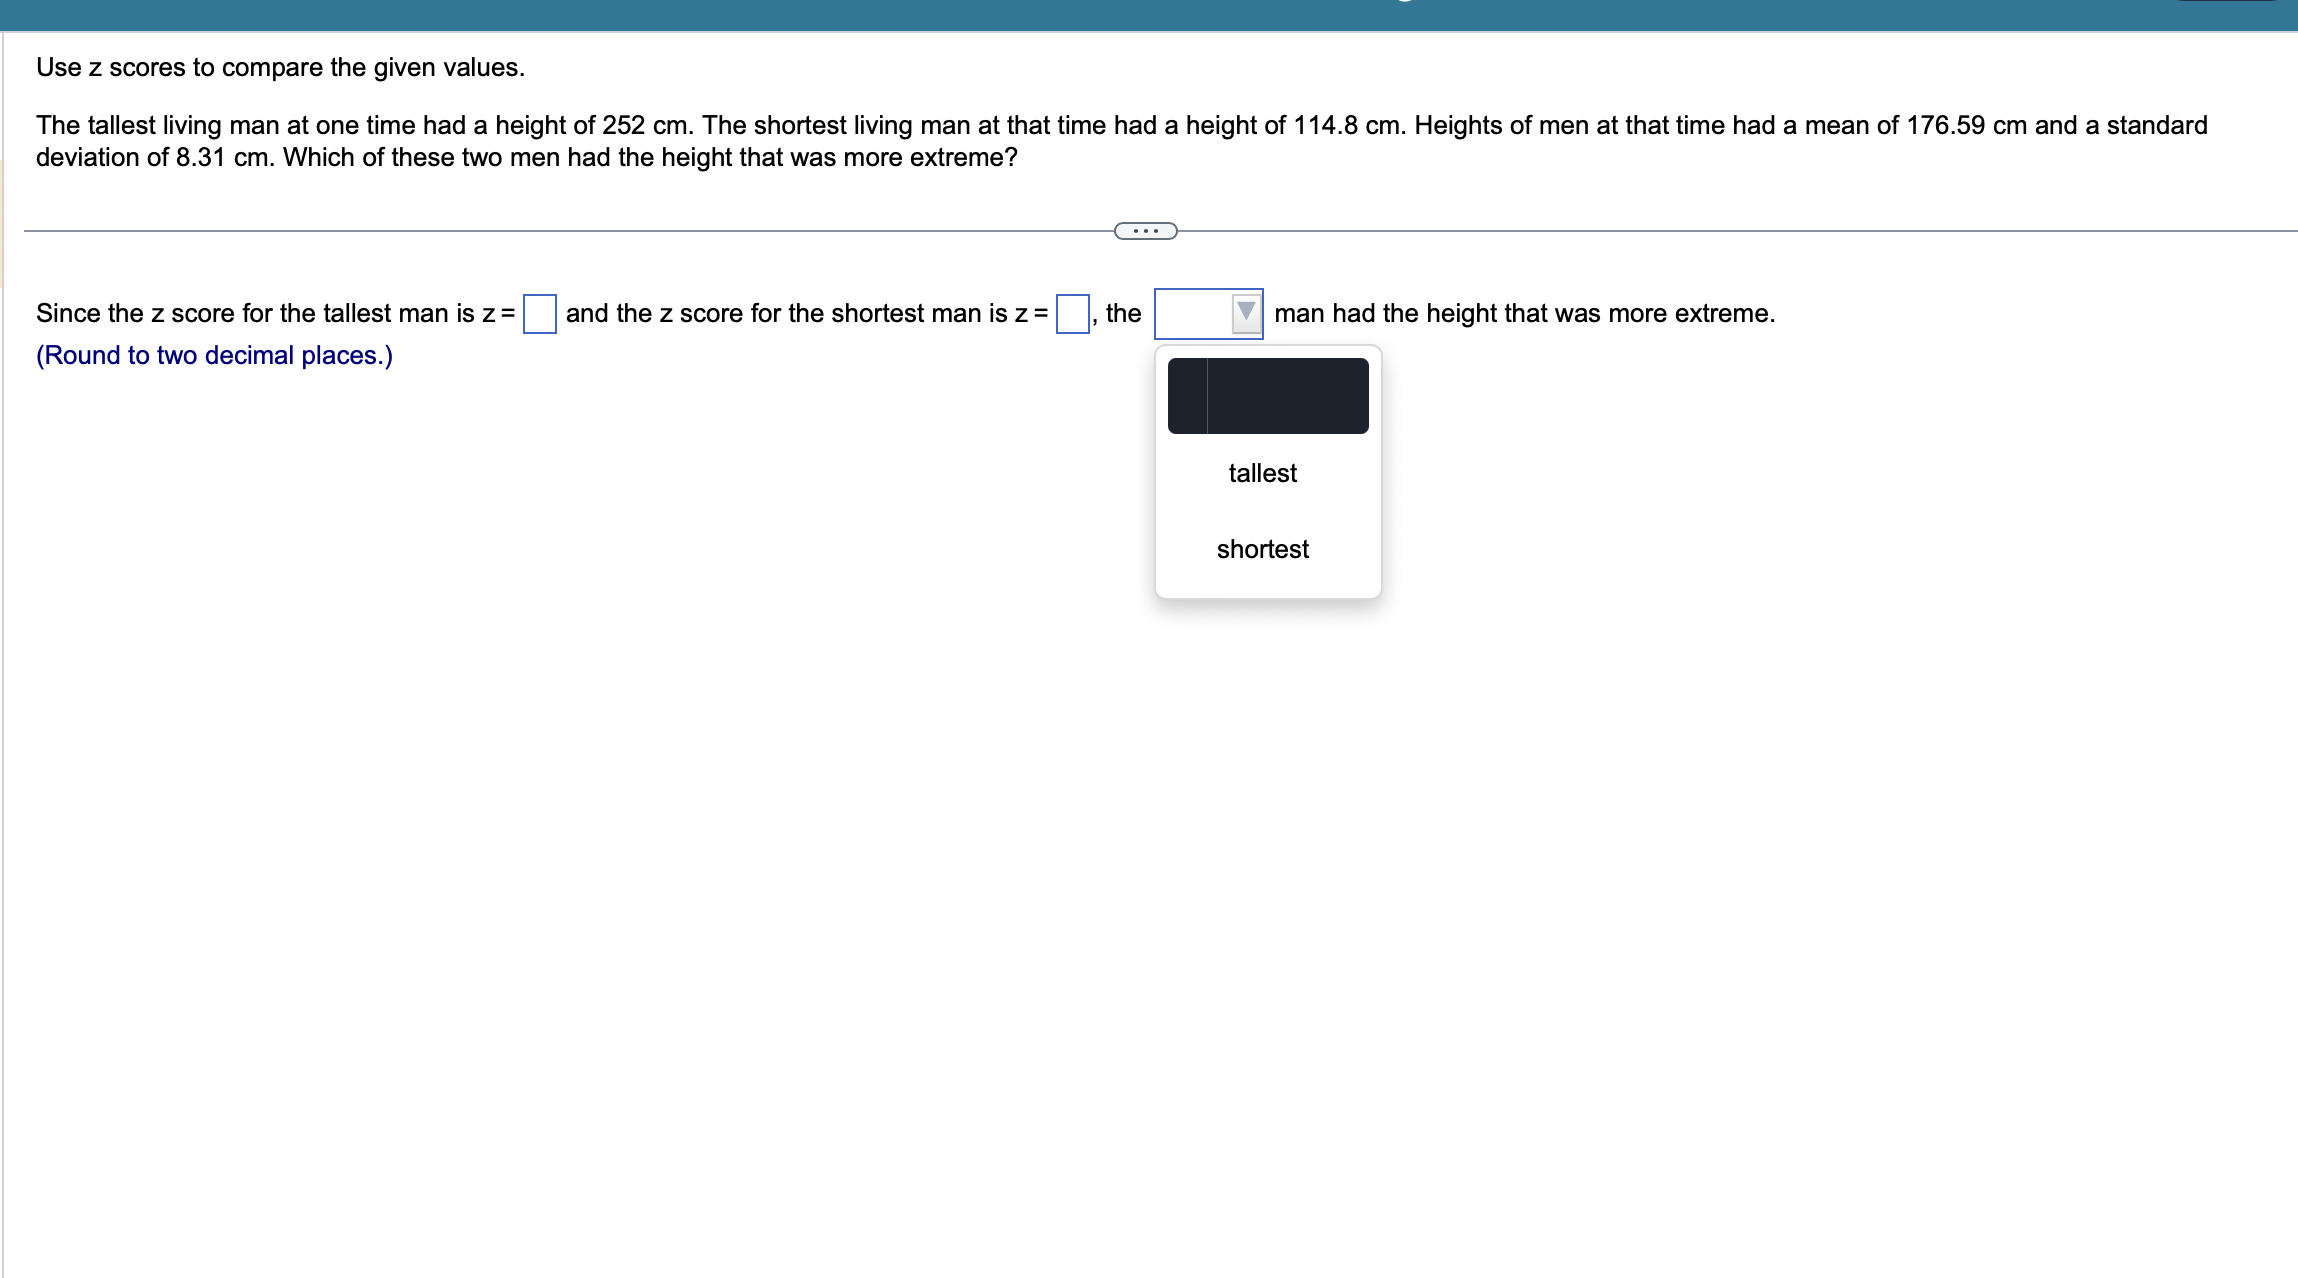
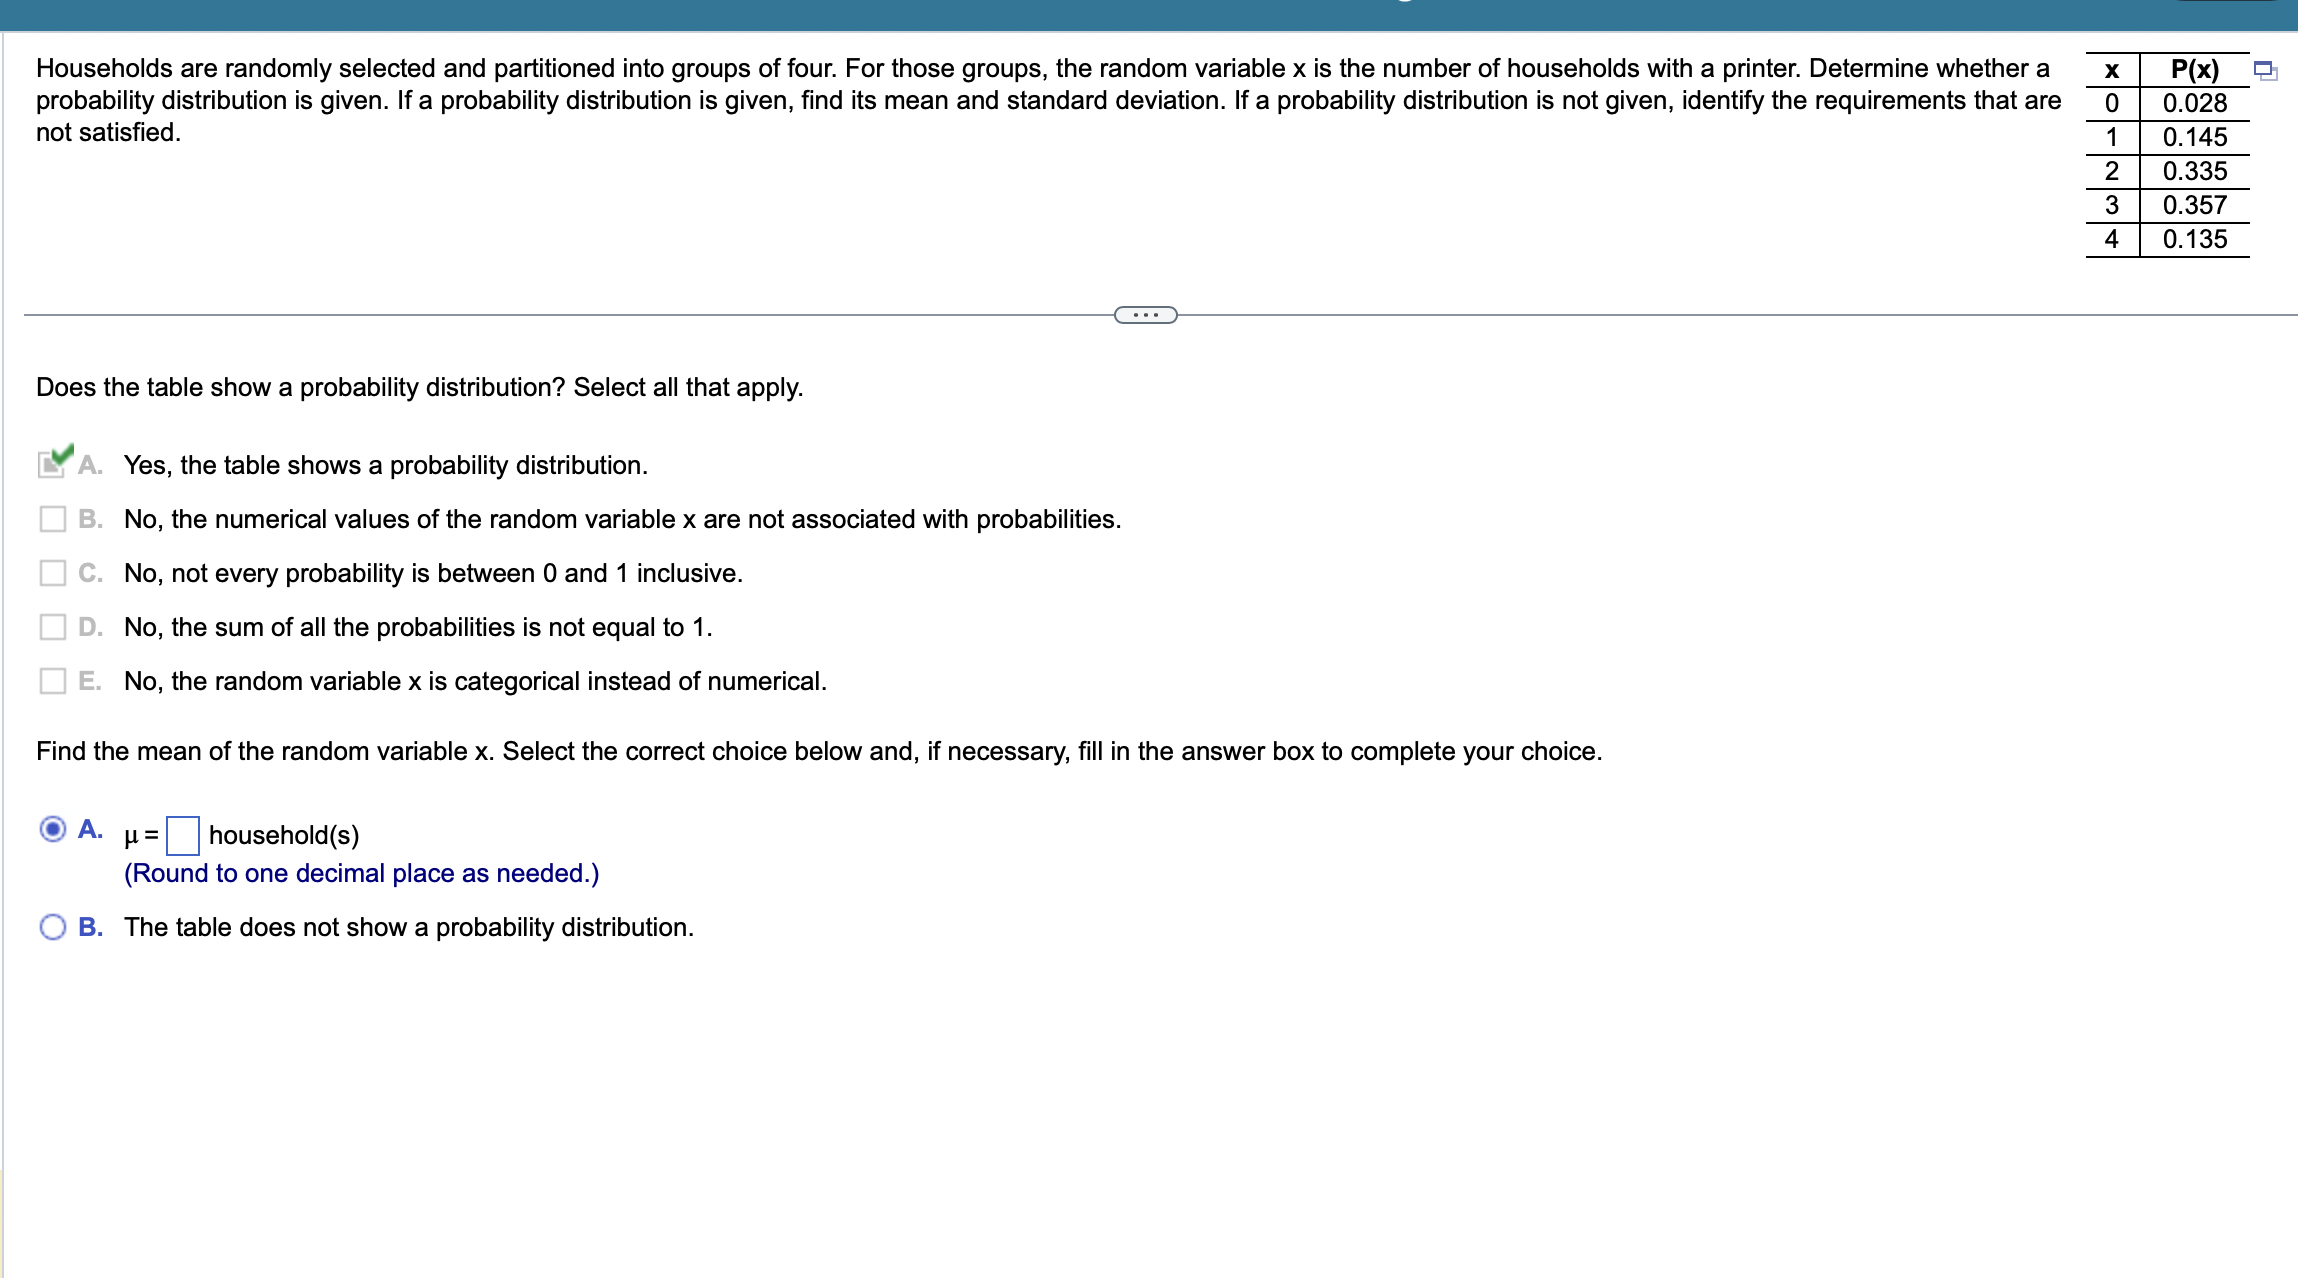
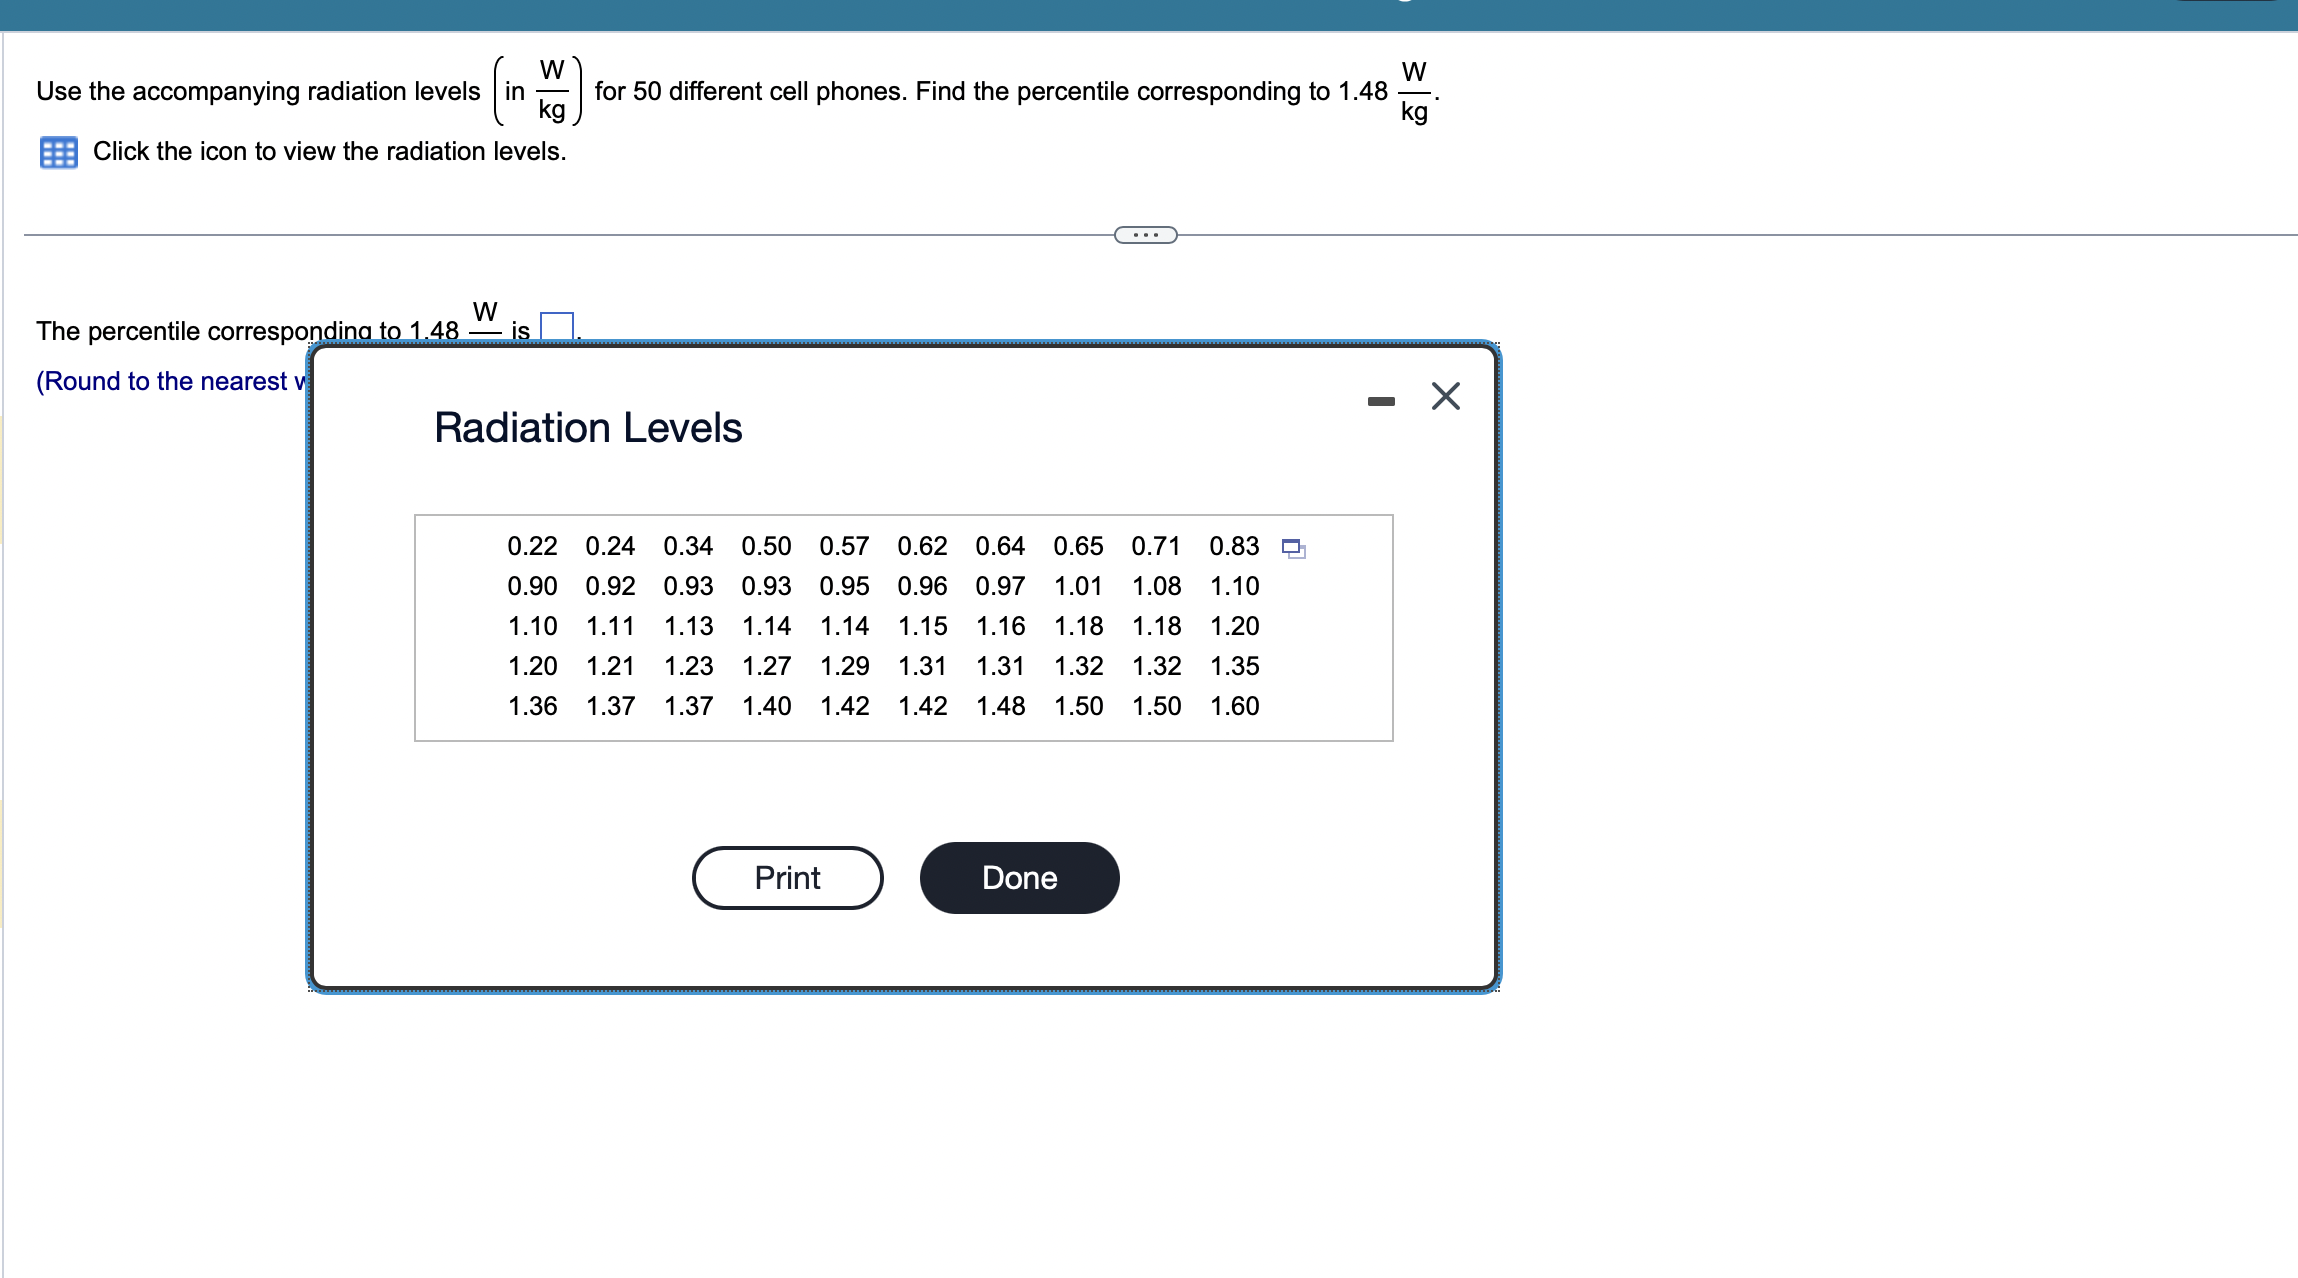
W . . . . . . . . . . :I Use the accompanying radiation levels [in ] for 50 different cell phones. Find the percentile 0 20 O 25 O 35 O 49 O 58 O 59 O 64 O 69 O 74 0 87 kg 0.90 0.93 0.93 0.94 0.95 0.96 0.97 1.01 1.07 1.10 1.10 1.13 1.13 1.14 1.15 1.18 1.18 1.19 1.21 1.21 1.21 1.22 1.26 1.27 1.30 1.31 1.31 1.34 1.34 1.35 1.37 1.38 1.38 1.40 1.42 1.44 1.45 1.47 1.49 1.52 P25. W P25 E (Type an integer or a decimal. Do not round.) Use the accompanying radiation levels (in ka ) for 50 different cel phones. Find the percentile corresponding to 1.48 W Click the icon to view the radiation levels. The percentile corresponding to 1.48 W is (Round to the nearest v - X Radiation Levels 0.22 0.24 0.34 0.50 0.57 0.62 0.64 0.65 0.71 0.83 0.90 0.92 0.93 0.93 0.95 0.96 0.97 1.01 1.08 1.10 1.10 1.11 1.13 1.14 1.14 1.15 1.16 1.18 1.18 1.20 1.20 1.21 1.23 1.27 1.29 1.31 1.31 1.32 1.32 1.35 1.36 1.37 1.37 1.40 1.42 1.42 1.48 1.50 1.50 1.60 Print DoneUse the accompanying radiation levels (in ka ) for for 50 different cell phones. Find the percentile corresponding to 1.06 W kg Click the icon to view the radiation levels. The percentile corresponding to 1.06 - W is (Round to the nearest v - X Radiation Levels 0.21 0.22 0.30 0.50 0.58 0.62 0.64 0.64 0.72 0.82 0.86 0.88 0.90 0.93 0.93 0.96 0.97 1.01 1.04 1.06 1.08 1.12 1.12 1.13 1.15 1.16 1.18 1.18 1.18 1.20 1.20 1.22 1.23 1.23 1.26 1.26 1.29 1.30 1.31 1.35 1.35 1.36 1.41 1.42 1.43 1.45 1.46 1.47 1.53 1.57 Print DoneUse 2 scores to compare the given values. The tallest living man at one time had a height of 252 cm. The shortest living man at that time had a height of 114.8 cm. Heights of men at that time had a mean of 176.59 cm and a standard deviation of 8.31 cm. Which of these two men had the height that was more extreme? Since the z score for the tallest man is z = D and the z score for the shortest man is z = D, the man had the height that was more extreme. (Round to two decimal places.) - tallest shortest Households are randomly selected and partitioned into groups of four. For those groups, the random variable x is the number of households with a printer. Determine whether a T P(x) El probability distribution is given. If a probability distribution is given, nd its mean and standard deviation. If a probability distribution is not given, identify the requirements that are 0 0.028 not satised. T 0.145 T 0.335 T 0.357 I 0.135 Does the table show a probability distribution? Select all that apply. V Yes, the table shows a probability distribution. No, the numerical values of the random variable x are not associated with probabilities. No, not every probability is between 0 and 1 inclusive. No, the sum of all the probabilities is not equal to 1. No, the random variable x is categorical instead of numerical. Find the mean of the random variable x. Select the correct choice below and, if necessary, ll in the answer box to complete your choice. A- p = household(s) (Round to one decimal place as needed.) (:3 B. The table does not show a probability distribution
Step by Step Solution
There are 3 Steps involved in it

Get step-by-step solutions from verified subject matter experts