

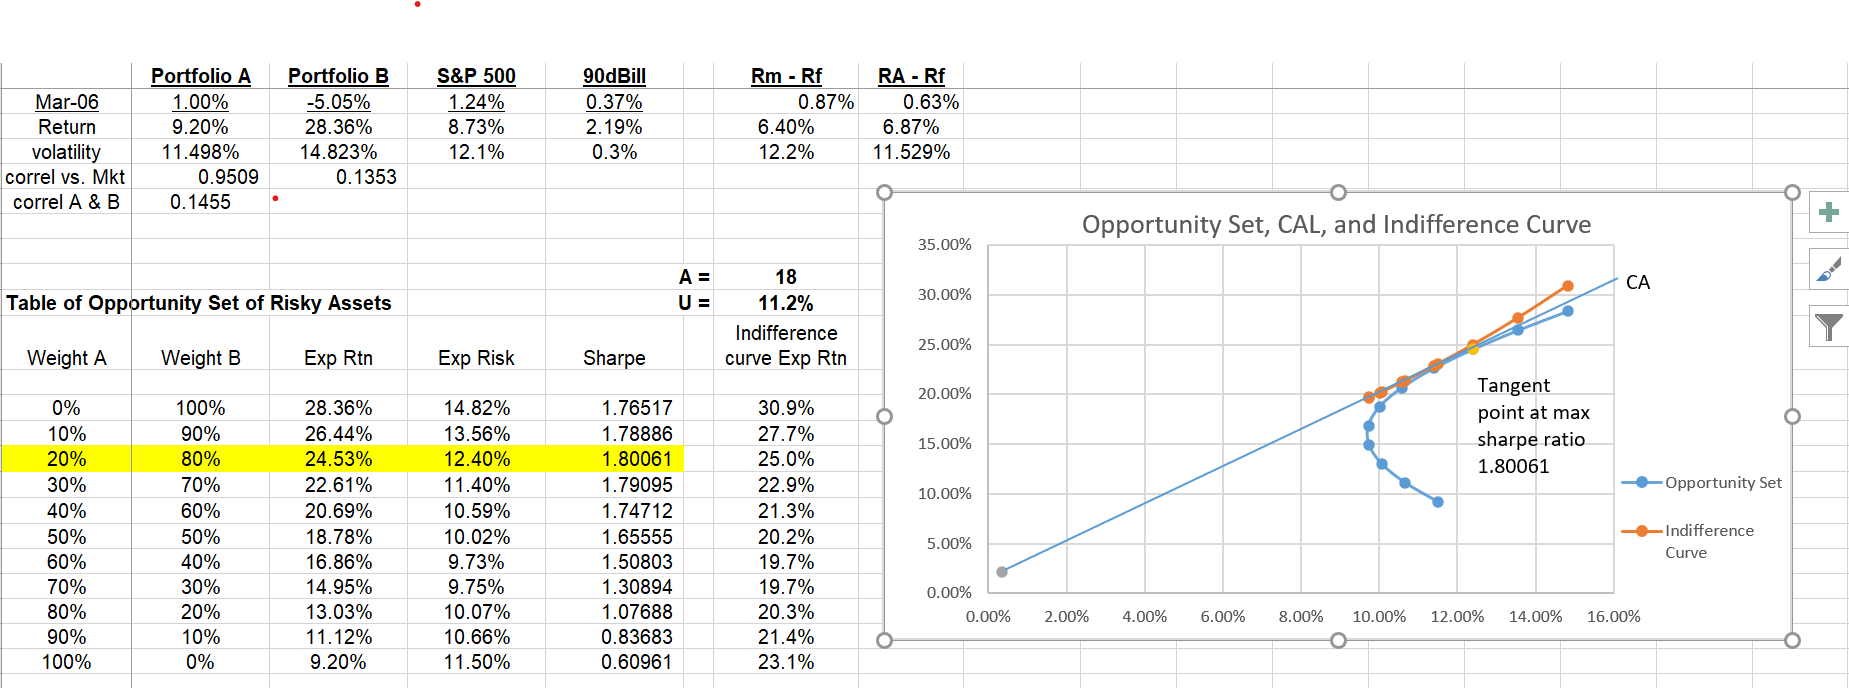
Question: Find the optimal complete portfolio graphically using the clients indifference curve. Plot an indifference curve on the same graph you just created using the utility
Find the optimal complete portfolio graphically using the clients indifference curve. Plot an indifference curve on the same graph you just created using the utility function formula from Chapter 6. To make things easier, you can use the same portfolio risk numbers from the table above and then calculate the expected return based on the values of utility (U) and risk aversion coefficient (A) in provided in the Excel spreadsheet. Plot the indifference curve AND the opportunity set of risky assets on the same graph. Please include excel formulas, to use on the graph along with the solution.
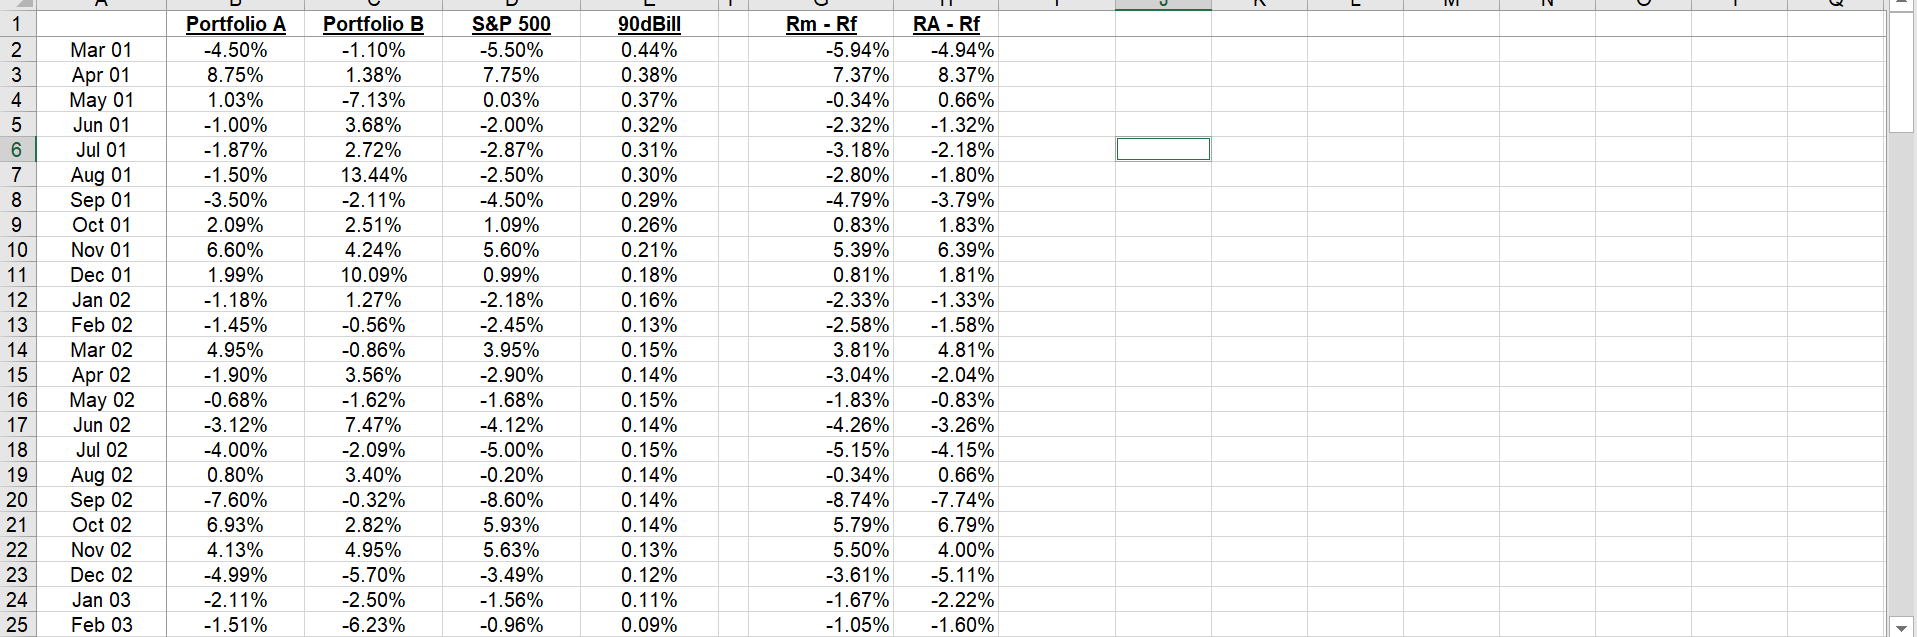
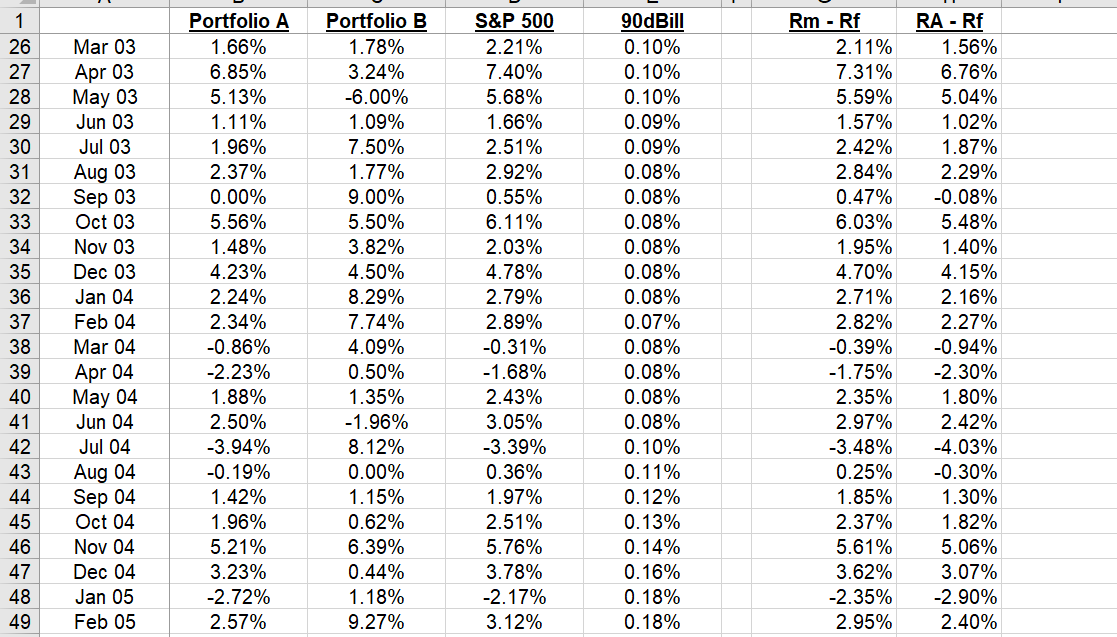
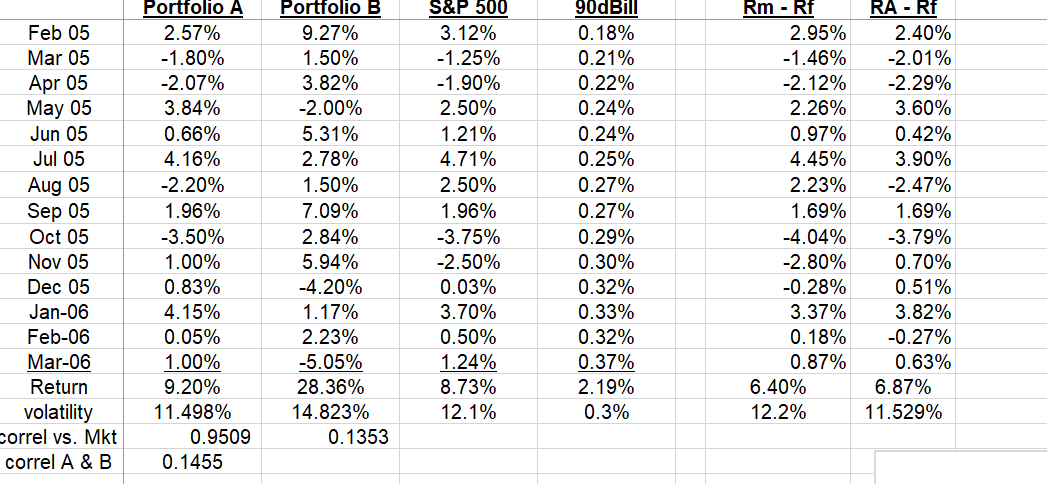
1 2 3 4 5 6 7 8 9 10 11 12 13 14 15 16 17 18 19 20 21 22 23 24 25 Mar 01 Apr 01 May 01 Jun 01 Jul 01 Aug 01 Sep 01 Oct 01 Nov 01 Dec 01 Jan 02 Feb 02 Mar 02 Apr 02 May 02 Jun 02 Jul 02 Aug 02 Sep 02 Oct 02 Nov 02 Dec 02 Jan 03 Feb 03 Portfolio A -4.50% 8.75% 1.03% -1.00% -1.87% -1.50% -3.50% 2.09% 6.60% 1.99% -1.18% -1.45% 4.95% -1.90% -0.68% -3.12% -4.00% 0.80% -7.60% 6.93% 4.13% -4.99% -2.11% -1.51% Portfolio B -1.10% 1.38% -7.13% 3.68% 2.72% 13.44% -2.11% 2.51% 4.24% 10.09% 1.27% -0.56% -0.86% 3.56% -1.62% 7.47% -2.09% 3.40% -0.32% 2.82% 4.95% -5.70% -2.50% -6.23% S&P 500 -5.50% 7.75% 0.03% -2.00% -2.87% -2.50% -4.50% 1.09% 5.60% 0.99% -2.18% -2.45% 3.95% -2.90% -1.68% -4.12% -5.00% -0.20% -8.60% 5.93% 5.63% -3.49% -1.56% -0.96% 90dBill 0.44% 0.38% 0.37% 0.32% 0.31% 0.30% 0.29% 0.26% 0.21% 0.18% 0.16% 0.13% 0.15% 0.14% 0.15% 0.14% 0.15% 0.14% 0.14% 0.14% 0.13% 0.12% 0.11% 0.09% Rm - Rf -5.94% 7.37% -0.34% -2.32% -3.18% -2.80% -4.79% 0.83% 5.39% 0.81% -2.33% -2.58% 3.81% -3.04% -1.83% -4.26% -5.15% -0.34% -8.74% 5.79% 5.50% -3.61% -1.67% -1.05% RA - Rf -4.94% 8.37% 0.66% -1.32% -2.18% -1.80% -3.79% 1.83% 6.39% 1.81% -1.33% -1.58% 4.81% -2.04% -0.83% -3.26% -4.15% 0.66% -7.74% 6.79% 4.00% -5.11% -2.22% -1.60% 1 Portfolio B Rm - Rf 26 27 28 29 30 31 32 33 34 35 36 37 38 39 40 41 42 43 44 45 46 47 48 49 Mar 03 Apr 03 May 03 Jun 03 Jul 03 Aug 03 Sep 03 Oct 03 Nov 03 Dec 03 Jan 04 Feb 04 Mar 04 Apr 04 May 04 Jun 04 Jul 04 Aug 04 Sep 04 Oct 04 Nov 04 Dec 04 Jan 05 Feb 05 Portfolio A 1.66% 6.85% 5.13% 1.11% 1.96% 2.37% 0.00% 5.56% 1.48% 4.23% 2.24% 2.34% -0.86% -2.23% 1.88% 2.50% -3.94% -0.19% 1.42% 1.96% 5.21% 3.23% -2.72% 2.57% 1.78% 3.24% -6.00% 1.09% 7.50% 1.77% 9.00% 5.50% 3.82% 4.50% 8.29% 7.74% 4.09% 0.50% 1.35% -1.96% 8.12% 0.00% 1.15% 0.62% 6.39% 0.44% 1.18% 9.27% S&P 500 2.21% 7.40% 5.68% 1.66% 2.51% 2.92% 0.55% 6.11% 2.03% 4.78% 2.79% 2.89% -0.31% -1.68% 2.43% 3.05% -3.39% 0.36% 1.97% 2.51% 5.76% 3.78% -2.17% 3.12% 90dBill 0.10% 0.10% 0.10% 0.09% 0.09% 0.08% 0.08% 0.08% 0.08% 0.08% 0.08% 0.07% 0.08% 0.08% 0.08% 0.08% 0.10% 0.11% 0.12% 0.13% 0.14% 0.16% 0.18% 0.18% 2.11% 7.31% 5.59% 1.57% 2.42% 2.84% 0.47% 6.03% 1.95% 4.70% 2.71% 2.82% -0.39% -1.75% 2.35% 2.97% -3.48% 0.25% 1.85% 2.37% 5.61% 3.62% -2.35% 2.95% RA - Rf 1.56% 6.76% 5.04% 1.02% 1.87% 2.29% -0.08% 5.48% 1.40% 4.15% 2.16% 2.27% -0.94% -2.30% 1.80% 2.42% -4.03% -0.30% 1.30% 1.82% 5.06% 3.07% -2.90% 2.40% S&P 500 3.12% -1.25% -1.90% 2.50% 90dBill 0.18% 0.21% 0.22% 0.24% 0.24% 0.25% Rm - Rf 2.95% -1.46% -2.12% 2.26% 0.97% 4.45% 2.23% 1.69% RA - Rf 2.40% -2.01% -2.29% 3.60% 0.42% 3.90% 1.21% 4.71% 0.27% -2.47% 0.27% Feb 05 Mar 05 Apr 05 May 05 Jun 05 Jul 05 Aug 05 Sep 05 Oct 05 Nov 05 Dec 05 Jan-06 Feb-06 Mar-06 Return volatility correl vs. Mkt correl A & B Portfolio A 2.57% -1.80% -2.07% 3.84% 0.66% 4.16% -2.20% 1.96% -3.50% 1.00% 0.83% 4.15% 0.05% 1.00% 9.20% 11.498% 0.9509 0.1455 Portfolio B 9.27% 1.50% 3.82% -2.00% 5.31% 2.78% 1.50% 7.09% 2.84% 5.94% -4.20% 1.17% 2.23% -5.05% 28.36% 14.823% 0.1353 2.50% 1.96% -3.75% -2.50% 0.03% 3.70% 0.50% 1.24% 8.73% 12.1% 0.29% 0.30% 0.32% 0.33% 0.32% 0.37% 2.19% 0.3% -4.04% -2.80% -0.28% 3.37% 0.18% 0.87% 6.40% 12.2% 1.69% -3.79% 0.70% 0.51% 3.82% -0.27% 0.63% 6.87% 11.529% Rm - Rf 0.87% Mar-06 Return volatility correl vs. Mkt correl A & B Portfolio A 1.00% 9.20% 11.498% 0.9509 0.1455 Portfolio B -5.05% 28.36% 14.823% 0.1353 S&P 500 1.24% 8.73% 12.1% 90dBill 0.37% 2.19% 0.3% RA - Rf 0.63% 6.87% 11.529% 6.40% 12.2% Opportunity Set, CAL, and Indifference Curve 35.00% A = CA 18 11.2% 30.00% Table of Opportunity Set of Risky Assets U= Y Indifference curve Exp Rtn 25.00% Weight A Weight B Exp Rtn Exp Risk Sharpe 20.00% 0% 14.82% O 100% 90% 80% 10% 20% 30% 28.36% 26.44% 24.53% Tangent point at max sharpe ratio 1.80061 15.00% 70% 22.61% Opportunity Set 10.00% 40% 60% Indifference 50% 60% 70% 80% 90% 100% 1.76517 1.78886 1.80061 1.79095 1.74712 1.65555 1.50803 1.30894 1.07688 0.83683 0.60961 13.56% 12.40% 11.40% 10.59% 10.02% 9.73% 9.75% 10.07% 10.66% 11.50% 50% 40% 30% 20% 10% 0% 5.00% 30.9% 27.7% 25.0% 22.9% 21.3% 20.2% 19.7% 19.7% 20.3% 21.4% 23.1% 20.69% 18.78% 16.86% 14.95% 13.03% 11.12% 9.20% Curve 0.00% 0.00% 2.00% 4.00% 6.00% 8.00% 10.00% 12.00% 14.00% 16.00% O 1 2 3 4 5 6 7 8 9 10 11 12 13 14 15 16 17 18 19 20 21 22 23 24 25 Mar 01 Apr 01 May 01 Jun 01 Jul 01 Aug 01 Sep 01 Oct 01 Nov 01 Dec 01 Jan 02 Feb 02 Mar 02 Apr 02 May 02 Jun 02 Jul 02 Aug 02 Sep 02 Oct 02 Nov 02 Dec 02 Jan 03 Feb 03 Portfolio A -4.50% 8.75% 1.03% -1.00% -1.87% -1.50% -3.50% 2.09% 6.60% 1.99% -1.18% -1.45% 4.95% -1.90% -0.68% -3.12% -4.00% 0.80% -7.60% 6.93% 4.13% -4.99% -2.11% -1.51% Portfolio B -1.10% 1.38% -7.13% 3.68% 2.72% 13.44% -2.11% 2.51% 4.24% 10.09% 1.27% -0.56% -0.86% 3.56% -1.62% 7.47% -2.09% 3.40% -0.32% 2.82% 4.95% -5.70% -2.50% -6.23% S&P 500 -5.50% 7.75% 0.03% -2.00% -2.87% -2.50% -4.50% 1.09% 5.60% 0.99% -2.18% -2.45% 3.95% -2.90% -1.68% -4.12% -5.00% -0.20% -8.60% 5.93% 5.63% -3.49% -1.56% -0.96% 90dBill 0.44% 0.38% 0.37% 0.32% 0.31% 0.30% 0.29% 0.26% 0.21% 0.18% 0.16% 0.13% 0.15% 0.14% 0.15% 0.14% 0.15% 0.14% 0.14% 0.14% 0.13% 0.12% 0.11% 0.09% Rm - Rf -5.94% 7.37% -0.34% -2.32% -3.18% -2.80% -4.79% 0.83% 5.39% 0.81% -2.33% -2.58% 3.81% -3.04% -1.83% -4.26% -5.15% -0.34% -8.74% 5.79% 5.50% -3.61% -1.67% -1.05% RA - Rf -4.94% 8.37% 0.66% -1.32% -2.18% -1.80% -3.79% 1.83% 6.39% 1.81% -1.33% -1.58% 4.81% -2.04% -0.83% -3.26% -4.15% 0.66% -7.74% 6.79% 4.00% -5.11% -2.22% -1.60% 1 Portfolio B Rm - Rf 26 27 28 29 30 31 32 33 34 35 36 37 38 39 40 41 42 43 44 45 46 47 48 49 Mar 03 Apr 03 May 03 Jun 03 Jul 03 Aug 03 Sep 03 Oct 03 Nov 03 Dec 03 Jan 04 Feb 04 Mar 04 Apr 04 May 04 Jun 04 Jul 04 Aug 04 Sep 04 Oct 04 Nov 04 Dec 04 Jan 05 Feb 05 Portfolio A 1.66% 6.85% 5.13% 1.11% 1.96% 2.37% 0.00% 5.56% 1.48% 4.23% 2.24% 2.34% -0.86% -2.23% 1.88% 2.50% -3.94% -0.19% 1.42% 1.96% 5.21% 3.23% -2.72% 2.57% 1.78% 3.24% -6.00% 1.09% 7.50% 1.77% 9.00% 5.50% 3.82% 4.50% 8.29% 7.74% 4.09% 0.50% 1.35% -1.96% 8.12% 0.00% 1.15% 0.62% 6.39% 0.44% 1.18% 9.27% S&P 500 2.21% 7.40% 5.68% 1.66% 2.51% 2.92% 0.55% 6.11% 2.03% 4.78% 2.79% 2.89% -0.31% -1.68% 2.43% 3.05% -3.39% 0.36% 1.97% 2.51% 5.76% 3.78% -2.17% 3.12% 90dBill 0.10% 0.10% 0.10% 0.09% 0.09% 0.08% 0.08% 0.08% 0.08% 0.08% 0.08% 0.07% 0.08% 0.08% 0.08% 0.08% 0.10% 0.11% 0.12% 0.13% 0.14% 0.16% 0.18% 0.18% 2.11% 7.31% 5.59% 1.57% 2.42% 2.84% 0.47% 6.03% 1.95% 4.70% 2.71% 2.82% -0.39% -1.75% 2.35% 2.97% -3.48% 0.25% 1.85% 2.37% 5.61% 3.62% -2.35% 2.95% RA - Rf 1.56% 6.76% 5.04% 1.02% 1.87% 2.29% -0.08% 5.48% 1.40% 4.15% 2.16% 2.27% -0.94% -2.30% 1.80% 2.42% -4.03% -0.30% 1.30% 1.82% 5.06% 3.07% -2.90% 2.40% S&P 500 3.12% -1.25% -1.90% 2.50% 90dBill 0.18% 0.21% 0.22% 0.24% 0.24% 0.25% Rm - Rf 2.95% -1.46% -2.12% 2.26% 0.97% 4.45% 2.23% 1.69% RA - Rf 2.40% -2.01% -2.29% 3.60% 0.42% 3.90% 1.21% 4.71% 0.27% -2.47% 0.27% Feb 05 Mar 05 Apr 05 May 05 Jun 05 Jul 05 Aug 05 Sep 05 Oct 05 Nov 05 Dec 05 Jan-06 Feb-06 Mar-06 Return volatility correl vs. Mkt correl A & B Portfolio A 2.57% -1.80% -2.07% 3.84% 0.66% 4.16% -2.20% 1.96% -3.50% 1.00% 0.83% 4.15% 0.05% 1.00% 9.20% 11.498% 0.9509 0.1455 Portfolio B 9.27% 1.50% 3.82% -2.00% 5.31% 2.78% 1.50% 7.09% 2.84% 5.94% -4.20% 1.17% 2.23% -5.05% 28.36% 14.823% 0.1353 2.50% 1.96% -3.75% -2.50% 0.03% 3.70% 0.50% 1.24% 8.73% 12.1% 0.29% 0.30% 0.32% 0.33% 0.32% 0.37% 2.19% 0.3% -4.04% -2.80% -0.28% 3.37% 0.18% 0.87% 6.40% 12.2% 1.69% -3.79% 0.70% 0.51% 3.82% -0.27% 0.63% 6.87% 11.529% Rm - Rf 0.87% Mar-06 Return volatility correl vs. Mkt correl A & B Portfolio A 1.00% 9.20% 11.498% 0.9509 0.1455 Portfolio B -5.05% 28.36% 14.823% 0.1353 S&P 500 1.24% 8.73% 12.1% 90dBill 0.37% 2.19% 0.3% RA - Rf 0.63% 6.87% 11.529% 6.40% 12.2% Opportunity Set, CAL, and Indifference Curve 35.00% A = CA 18 11.2% 30.00% Table of Opportunity Set of Risky Assets U= Y Indifference curve Exp Rtn 25.00% Weight A Weight B Exp Rtn Exp Risk Sharpe 20.00% 0% 14.82% O 100% 90% 80% 10% 20% 30% 28.36% 26.44% 24.53% Tangent point at max sharpe ratio 1.80061 15.00% 70% 22.61% Opportunity Set 10.00% 40% 60% Indifference 50% 60% 70% 80% 90% 100% 1.76517 1.78886 1.80061 1.79095 1.74712 1.65555 1.50803 1.30894 1.07688 0.83683 0.60961 13.56% 12.40% 11.40% 10.59% 10.02% 9.73% 9.75% 10.07% 10.66% 11.50% 50% 40% 30% 20% 10% 0% 5.00% 30.9% 27.7% 25.0% 22.9% 21.3% 20.2% 19.7% 19.7% 20.3% 21.4% 23.1% 20.69% 18.78% 16.86% 14.95% 13.03% 11.12% 9.20% Curve 0.00% 0.00% 2.00% 4.00% 6.00% 8.00% 10.00% 12.00% 14.00% 16.00% O
Step by Step Solution
There are 3 Steps involved in it

Get step-by-step solutions from verified subject matter experts