

Question: Instructions from assignment: Find the optimal complete portfolio graphically using the client s indifference curve. Plot an indifference curve on the same graph you just
Instructions from assignment:
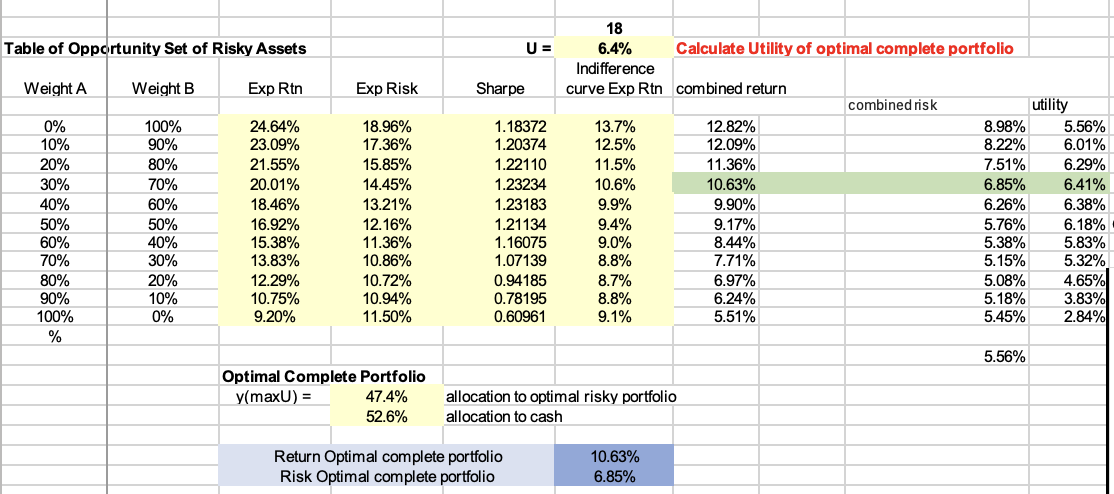
Find the optimal complete portfolio graphically using the clients indifference curve.
Plot an indifference curve on the same graph you just created using the utility function formula from Chapter To make things easier, you can use the same portfolio risk numbers from the table above. However, you will first need to calculate the utility of the optimal complete portfolio in the space provided in the Excel spreadsheet. The risk aversion coefficient A has been provided. Plot the indifference curve AND the opportunity set of risky assets on the same graph.
How do I plot the indifference curve in excel? What values are used?
Table for opportunity set of risky assets pictured.
Step by Step Solution
There are 3 Steps involved in it
1 Expert Approved Answer
Step: 1 Unlock

Question Has Been Solved by an Expert!
Get step-by-step solutions from verified subject matter experts
Step: 2 Unlock
Step: 3 Unlock