

Question: Find the range and standard deviation for the data items in the given bar graph. Frequency for Given Data Frequency 20 30 40 50
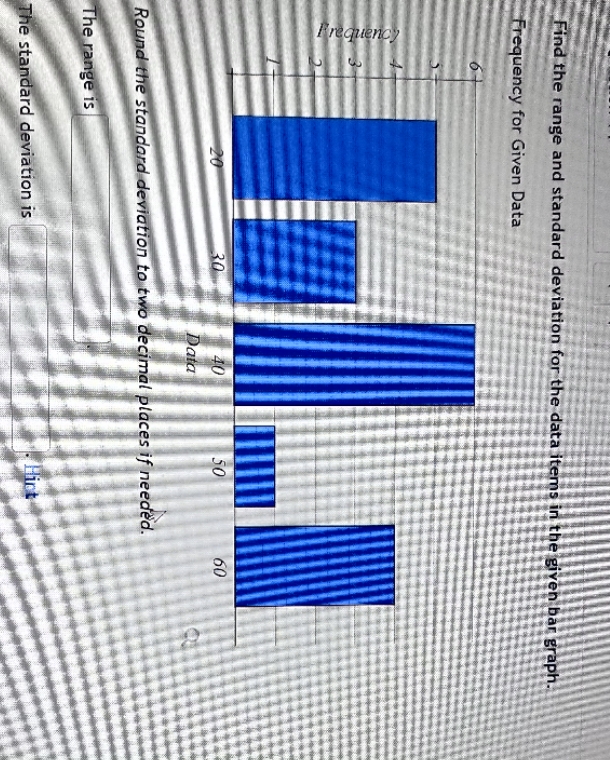
Find the range and standard deviation for the data items in the given bar graph. Frequency for Given Data Frequency 20 30 40 50 Data Round the standard deviation to two decimal places if needed. The range is The standard deviation is Hict 60 60
Step by Step Solution
There are 3 Steps involved in it
1 Expert Approved Answer
Step: 1 Unlock

Question Has Been Solved by an Expert!
Get step-by-step solutions from verified subject matter experts
Step: 2 Unlock
Step: 3 Unlock