

Question: Find the standard deviation, s, of sample data summarized in the frequency distribution table given below by using the formula below, where x represents the

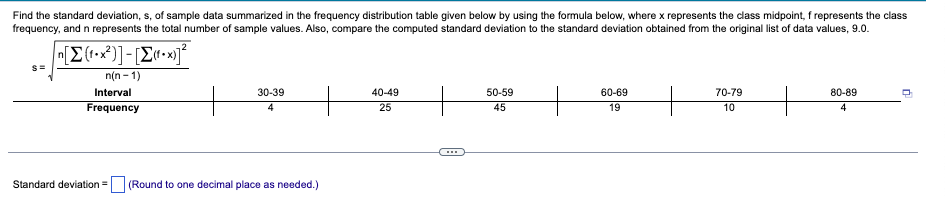
Find the standard deviation, s, of sample data summarized in the frequency distribution table given below by using the formula below, where x represents the class midpoint, f represents the class frequency, and in represents the total number of sample values. Also, compare the computed standard deviation to the standard deviation obtained from the original list of data values, 9.0. [E(.x]-[E(-x)]2 n(n - 1) 70-79 80-89 Interval 30-39 40-49 50-59 60-69 Frequency 25 45 19 10 4 Standard deviation = (Round to one decimal place as needed.)
Step by Step Solution
There are 3 Steps involved in it
1 Expert Approved Answer
Step: 1 Unlock

Question Has Been Solved by an Expert!
Get step-by-step solutions from verified subject matter experts
Step: 2 Unlock
Step: 3 Unlock