

Question: Find the standard deviation, s, of sample data summarized in the frequency distribution table given below by using the formula below, where x represents the
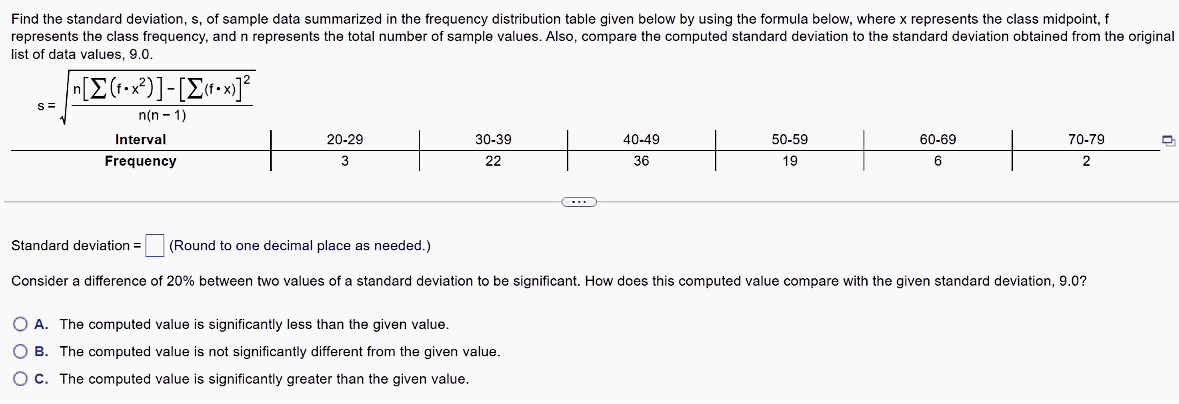
Find the standard deviation, s, of sample data summarized in the frequency distribution table given below by using the formula below, where x represents the class midpoint, f represents the class frequency, and n represents the total number of sample values. Also, compare the computed standard deviation to the standard deviation obtained from the original list of data values, 9.0. [E(fox 2) ] - [[(-x )]2 S= n(n - 1) Interval 20-29 30-39 40-49 50-59 60-69 70-79 Frequency 3 22 36 19 6 2 . . . Standard deviation = (Round to one decimal place as needed.) Consider a difference of 20% between two values of a standard deviation to be significant. How does this computed value compare with the given standard deviation, 9.0? O A. The computed value is significantly less than the given value. O B. The computed value is not significantly different from the given value. O C. The computed value is significantly greater than the given value
Step by Step Solution
There are 3 Steps involved in it

Get step-by-step solutions from verified subject matter experts