

Question: Find the test statistics, critical value and p value. The following table shows the average hourly wage rates for day-care centers from two locations based
Find the test statistics, critical value and p value.
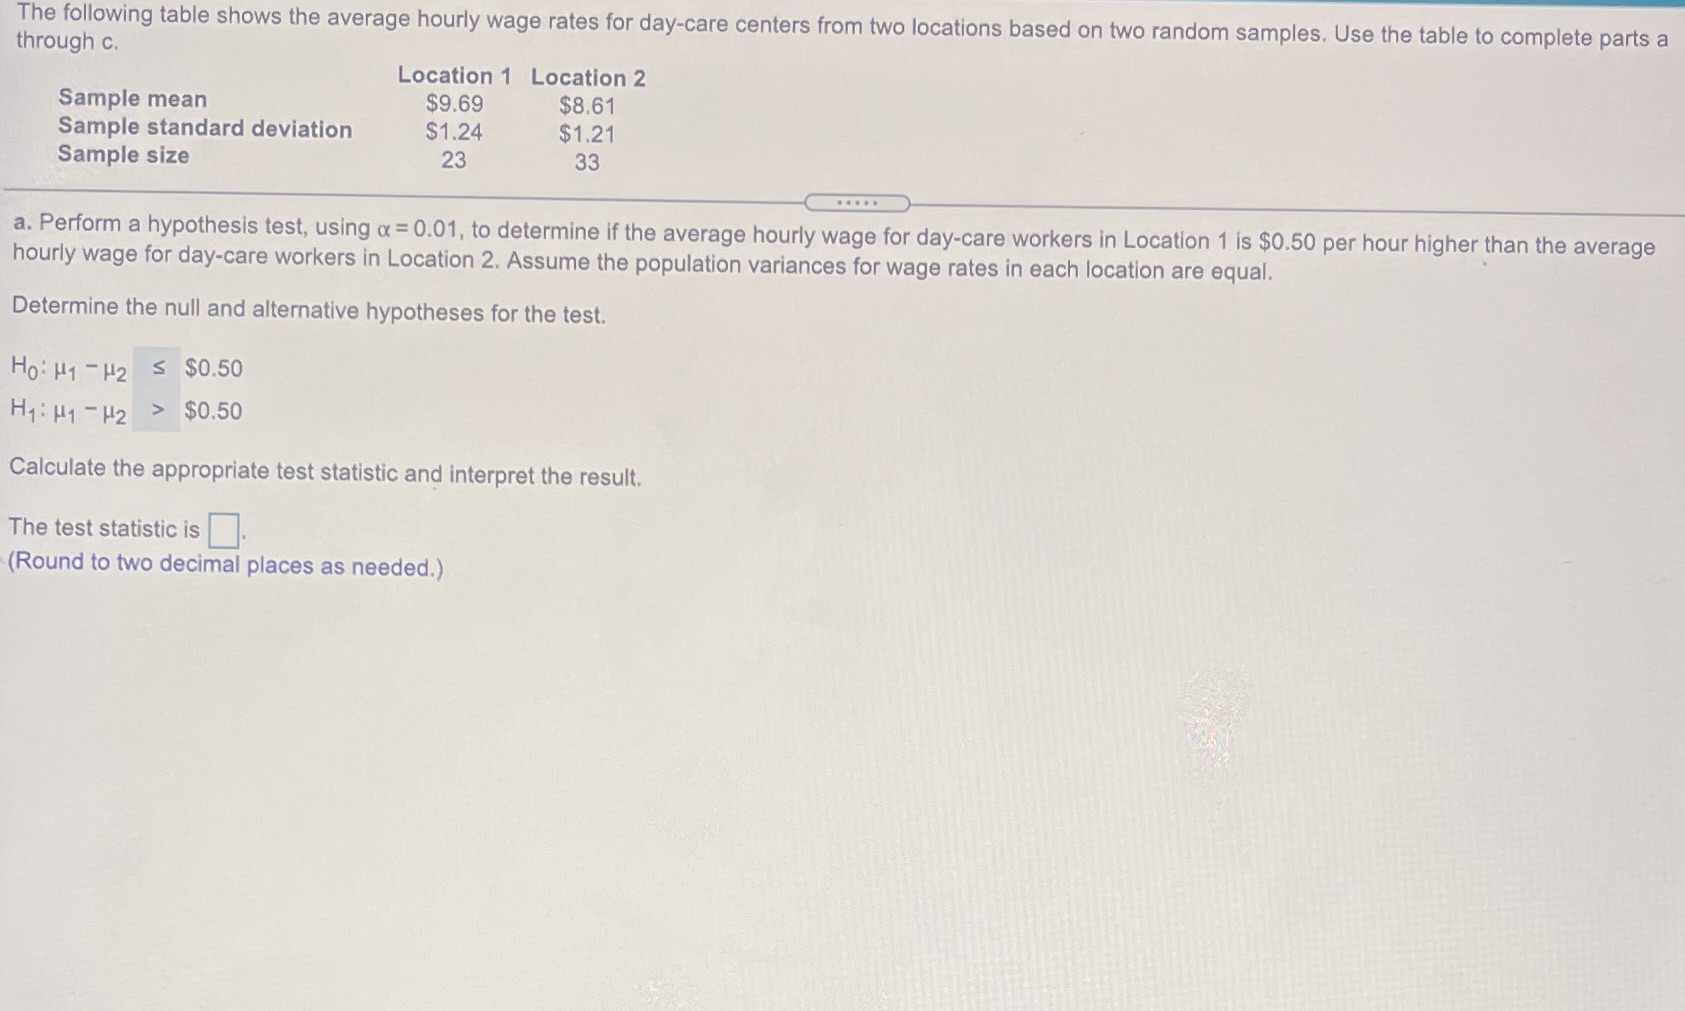
The following table shows the average hourly wage rates for day-care centers from two locations based on two random samples. Use the table to complete parts a through c. Location 1 Location 2 Sample mean $9.69 $8.61 Sample standard deviation $1.24 $1.21 Sample size 23 33 a. Perform a hypothesis test, using a = 0.01, to determine if the average hourly wage for day-care workers in Location 1 is $0.50 per hour higher than the average hourly wage for day-care workers in Location 2. Assume the population variances for wage rates in each location are equal. Determine the null and alternative hypotheses for the test. Ho: H1 - H2 S $0.50 H1: H1 -H2 > $0.50 Calculate the appropriate test statistic and interpret the result. The test statistic is. (Round to two decimal places as needed.)
Step by Step Solution
There are 3 Steps involved in it

Get step-by-step solutions from verified subject matter experts