

Question: The following table shows the average hourly wage rates for day care centers from the Northeast and Midwest regions of the United States based on
The following table shows the average hourly wage rates for day care centers from the Northeast and Midwest regions of the United States based on two random samples:
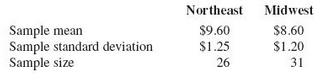
a. Perform a hypothesis test using α = 0.05 to determine if the average hourly wage for day care workers in the Northeast is $ 0.50 per hour higher than day care workers in the Midwest. Assume the population variances for wage rates in each region are equal.
b. Approximate the p value using Table 5 in Appendix A and interpret the results.
c. Determine the precise p value using Excel.
d. Verify your results using PHStat.
e. What assumptions need to be made in order to perform this procedure?
Northeast Midwest $9.60 $8.60 Sample mean Sample standard deviation S25 S1.20 Sample size 26 31
Step by Step Solution
3.43 Rating (159 Votes )
There are 3 Steps involved in it
a There is not enough evidence that the average hourl... View full answer

Get step-by-step solutions from verified subject matter experts
Document Format (1 attachment)
483-M-S-H-T (1485).docx
120 KBs Word File