

Question: Find the upper control limit AND lower control limit for 3-sigma x bar chart Also find the upper and lower control limits for 3-sigma R
Find the upper control limit AND lower control limit for 3-sigma x bar chart
Also find the upper and lower control limits for 3-sigma R bar chart
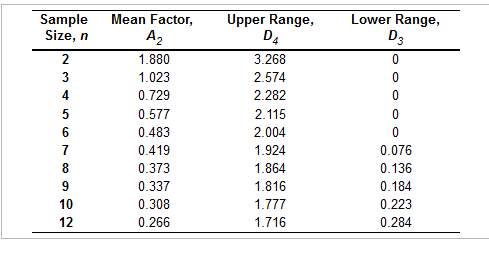
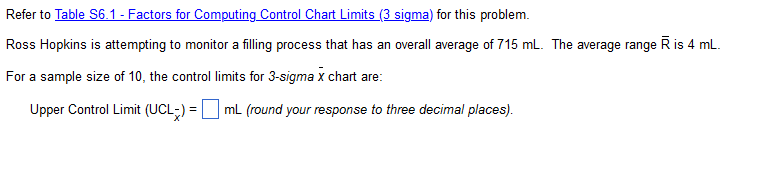
Sample Size, n 2 3 4 5678912 10 Mean Factor, A 1.880 1.023 0.729 0.577 0.483 0.419 0.373 0.337 0.308 0.266 Upper Range, D4 3.268 2.574 2.282 2.115 2.004 1.924 1.864 1.816 1.777 1.716 Lower Range, D3 0 0 0 0 0 0.076 0.136 0.184 0.223 0.284 Refer to Table S6.1-Factors for Computing Control Chart Limits (3 sigma) for this problem. Ross Hopkins is attempting to monitor a filling process that has an overall average of 715 mL. The average range R is 4 mL. For a sample size of 10, the control limits for 3-sigma x chart are: Upper Control Limit (UCL-) = mL (round your response to three decimal places)Step by Step Solution
There are 3 Steps involved in it
1 Expert Approved Answer
Step: 1 Unlock

Question Has Been Solved by an Expert!
Get step-by-step solutions from verified subject matter experts
Step: 2 Unlock
Step: 3 Unlock