

Question: finish the chart and answer the following: Do the samples for hours 26 through 30 indicate that the process is in control? Based on the
finish the chart and answer the following:
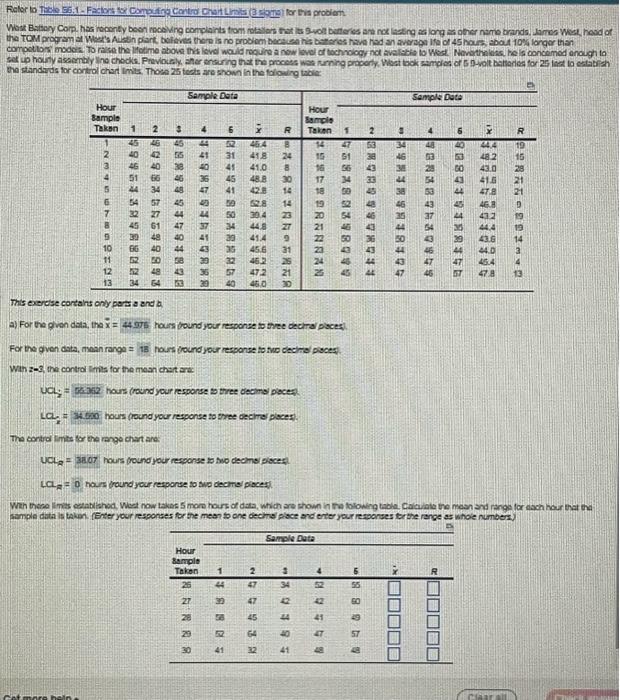
Do the samples for hours 26 through 30 indicate that the process is in control?
Based on the x-chart, the process has been
In control
Out of control
Based on the R-chart, the process has been
In control
Out of control
Step by Step Solution
There are 3 Steps involved in it
1 Expert Approved Answer
Step: 1 Unlock

Question Has Been Solved by an Expert!
Get step-by-step solutions from verified subject matter experts
Step: 2 Unlock
Step: 3 Unlock