

Question: First questions asks which bar chart shows the given distribution (majors). The correct answer is cAnd last question asks which of the following is the
First questions asks which bar chart shows the given distribution (majors). The correct answer is cAnd last question asks which of the following is the best description of the distributions important features A. Mode is Math and ScienceB. Mode is Interdisciplinary C. Mode is Social ScienceD. Mode is Humanities
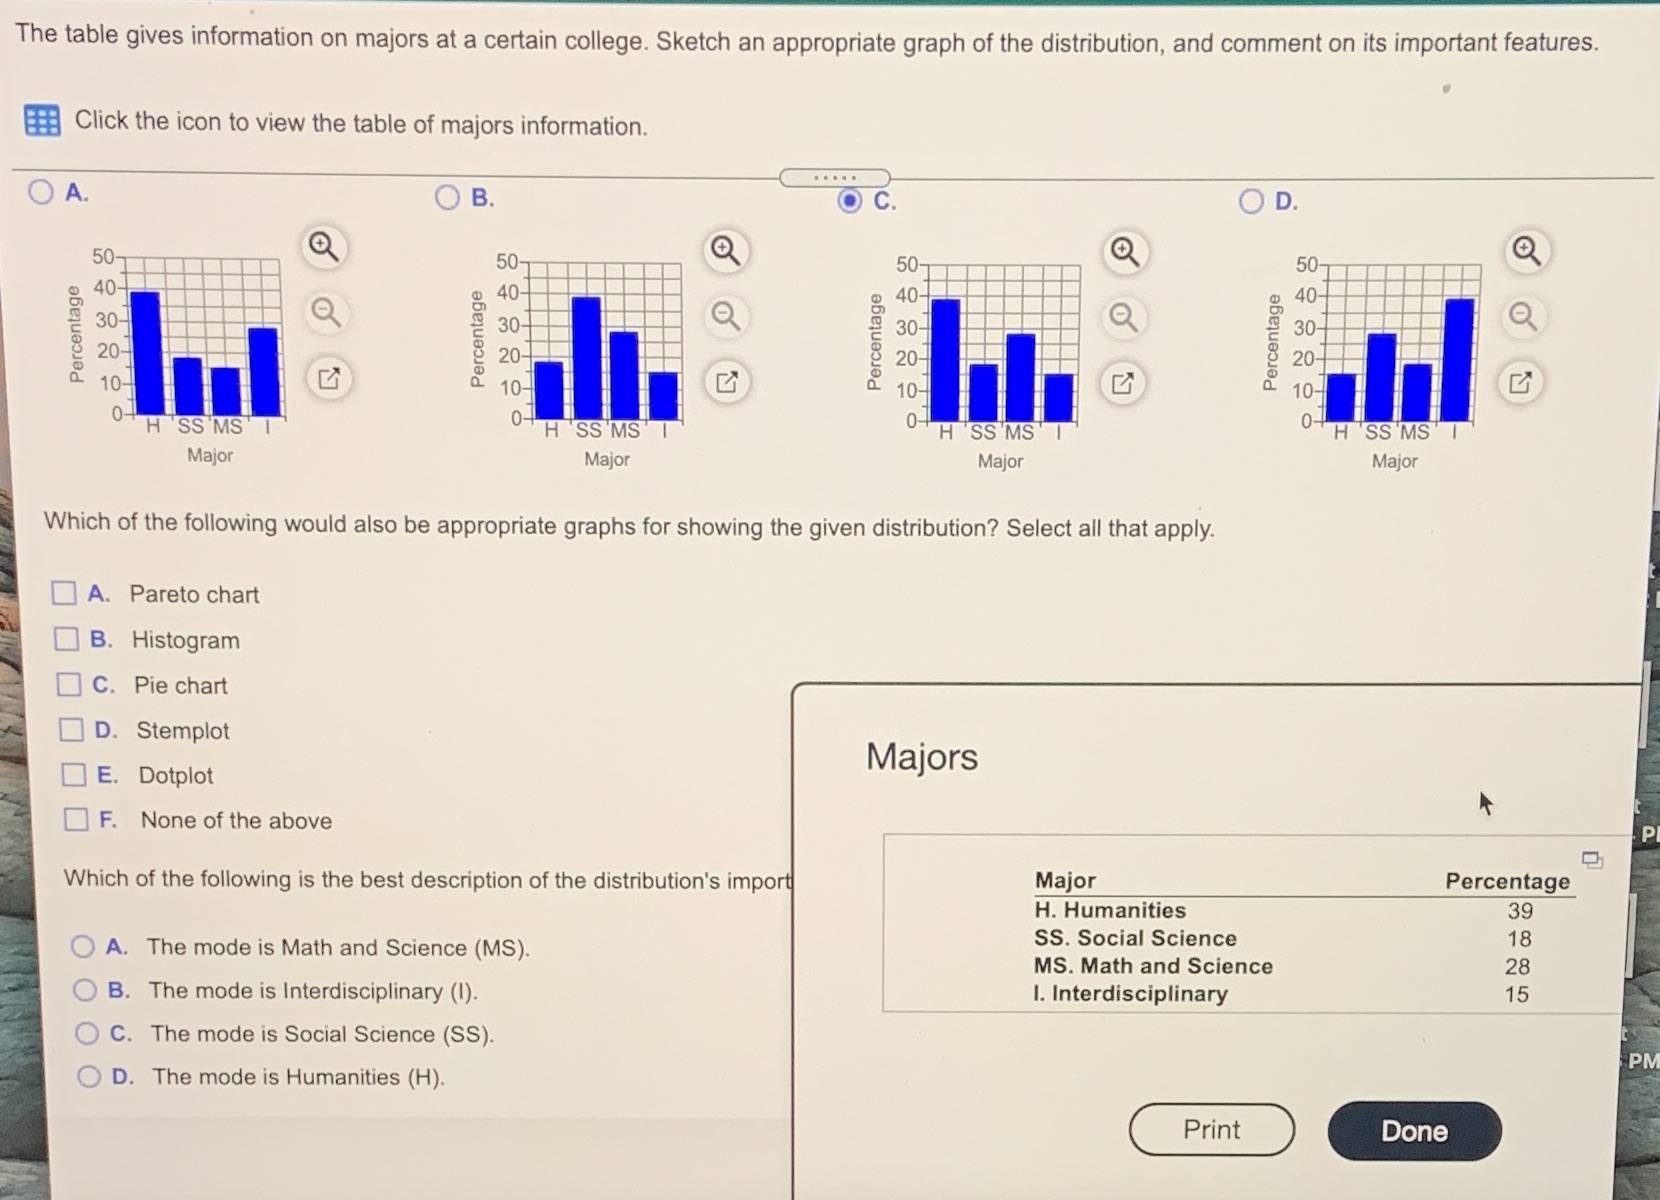
The table gives information on majors at a certain college. Sketch an appropriate graph of the distribution. and comment on its important features. a Click the icon to view the table of majors information. Percentage Which of the following would also be apprOpn'ate graphs for showing the given distribution? Select all that apply. [3 A. Pareto chart C] B. Histogram [I C. Pie chart I] D. Stemplot [I E. Dotplot E] F. None of the above Which of the following is the best description of the distribution's impo M8107 Percentage E: H. Humanities 39 1B - - 58. Social Sclence O A. The mode Is Math and Scrence (MS). MS. Math and Science 28 l. Interdisclpllnary 15 O B. The mode is Interdisciplinary (I). O C. The mode is Social Science (SS). 0 D. The mode is Humanities (H)
Step by Step Solution
There are 3 Steps involved in it

Get step-by-step solutions from verified subject matter experts