

Question: First Run a regression using the given data from 1990 to 2001 having GDP as the dependent variable and the rest as independent variable 2.Then
- First Run a regression using the given data from 1990 to 2001 having GDP as the dependent variable and the rest as independent variable
2.Then run 15 more recursive regressions by adding one year at a time to the above until end of data. (First run a regression for data from 1990-2001 and then from 1990 to 2002 and so on adding one year at a time)
3.In total you should have 16 regressions
4.Tabulate the estimated Coefficients,
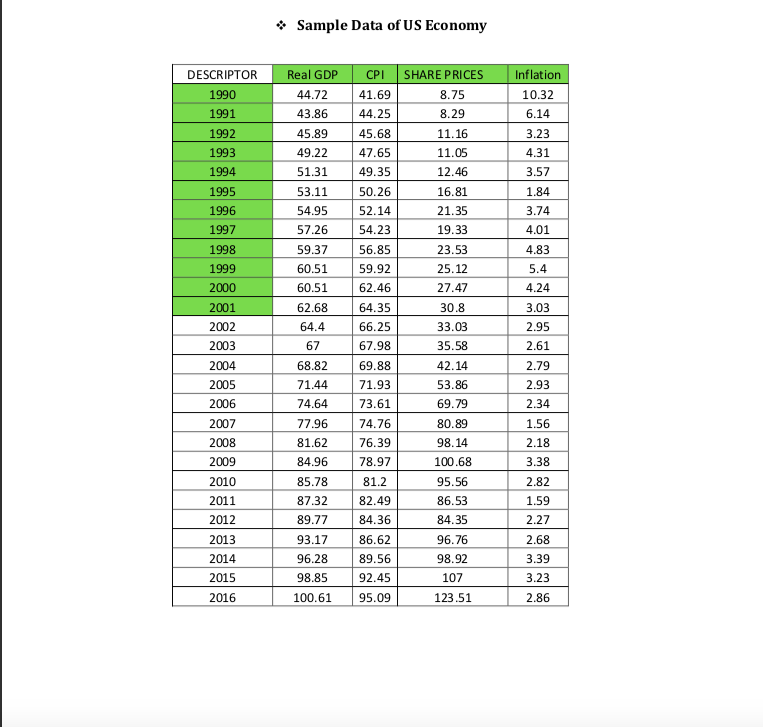
* Sample Data of US Economy* DESCRIPTOR Real GDP CPI SHARE PRICES Inflation 1950 4 4.72 41.69 10.32 1991 43.85 4 4. 25 8.29 6 . 14 1992 45. 89 \\45. 68 1 1. 15 3.23 1993 49. 22 47.65 11 . OF 4.31 1994 51.31 49. 35 12. 46 3.57 1995 53.11 50. 26 15 . 81 1.84 1995 54. 95 52. 14 21 . 35 3.74 1997 57. 25 54. 23 19. 33 4. 01 1998 59. 37 56. 85 23.53 4.83 1995 5.0.51 59. 92 25. 12 5. 4 20100 60. 51 6.2. 46 27.47 4. 24 20101 62.68 \\6. 4 . 35 30. 8 3.03 2002 64 . 4 65 . 25 3.3. 03 2.95 20:03 67 67. 98 35. 58 2. 61 20:04 5.8.82 69. 88 $2. 14 2.79 20:05 71.44 \\71.93 53. 85 2.93 20105 74.54 73.51 59. 79 2.34 20107 17.96 \\74 .76 80. 89 1.56 20:08 81.62 \\76. 30 98. 14 2.18 20:09 84.95 | 78.97 100 . 68 3.38 2010 85. 78 81 . 2 95. 5{ 2.82 201 1 87.32 82.49 86. 53 1.59 2012 89. 77 84. 36 8:4. 35 2.27 2013 93.17 86. 52 95 . 75 2.58 2014 96. 28 89.56 98.92 3.39 2015 98.85 92.45 107 3.23 2015 100. 61 \\95.09 123.51 2.85
Step by Step Solution
There are 3 Steps involved in it

Get step-by-step solutions from verified subject matter experts