Question: First two pictures are there for background information to help answer the 5 questions. Assignment #1 deals with some of the Excel tools we used
First two pictures are there for background information to help answer the 5 questions.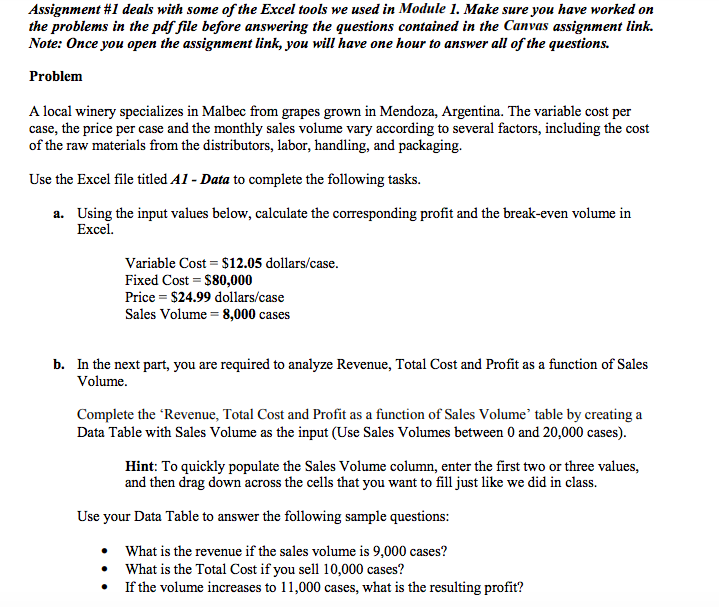
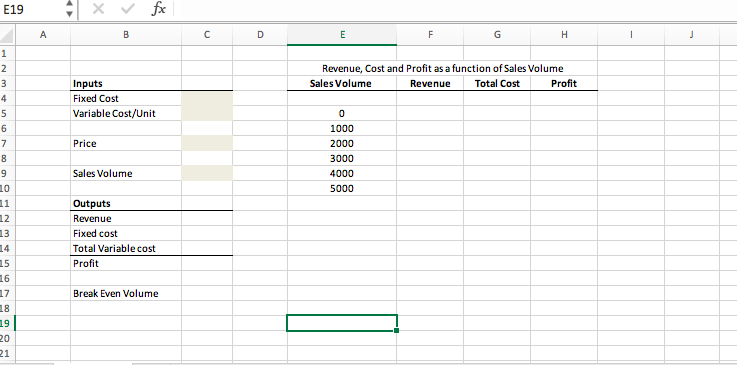
Assignment #1 deals with some of the Excel tools we used in Module 1. Make sure you have worked on the problems in the pdf file before answering the questions contained in the Canvas assignment link. Note: Once you open the assignment link, you will have one hour to answer all of the questions. Problem A local winery specializes in Malbec from grapes grown in Mendoza, Argentina. The variable cost per case, the price per case and the monthly sales volume vary according to several factors, including the cost of the raw materials from the distributors, labor, handling, and packaging. Use the Excel file titled Al - Data to complete the following tasks. a. Using the input values below, calculate the corresponding profit and the break-even volume in Excel. Variable Cost = $12.05 dollars/case. Fixed Cost = $80,000 Price = $24.99 dollars/case Sales Volume = 8,000 cases b. In the next part, you are required to analyze Revenue, Total Cost and Profit as a function of Sales Volume. Complete the 'Revenue, Total Cost and Profit as a function of Sales Volume table by creating a Data Table with Sales Volume as the input (Use Sales Volumes between 0 and 20,000 cases). Hint: To quickly populate the Sales Volume column, enter the first two or three values, and then drag down across the cells that you want to fill just like we did in class. Use your Data Table to answer the following sample questions: What is the revenue if the sales volume is 9,000 cases? What is the Total Cost if you sell 10,000 cases? If the volume increases to 11,000 cases, what is the resulting profit? E19 x fx B C D E F G H 1 Revenue, Cost and Profit as a function of Sales Volume Sales Volume Revenue Total Cost Profit Inputs Fixed Cost Variable Cost/Unit 1 2 3 4 5 6 7 8 9 10 11 12 Price 0 1000 2000 3000 4000 5000 Sales Volume Outputs Revenue Fixed cost Total Variable cost Profit 13 14 15 16 17 18 19 Break Even Volume 21 Assignment 1 deals with some of the Excel tools we used in Module 1. Before answering the questions contained in the assignment, make sure you review all the assignment resources and work on the sample questions included in the corresponding assignment PDF file. Assignment 1 - Resources To begin the assessment, click on the button below. Once you start the assessment, you will have one hour to answer all of the questions. Good luck! Question 1 2 pts Use your data table to report the Total Cost if you sell 14,000 cases (When entering your answer, do not use the $ sign). Question 2 2 pts Using the input values provided in the first part of the assignment, report the break-even volume. Question 3 2 pts Using the input values provided in the first part of the assignment, report the corresponding profit if 8,000 cases are sold (When entering your answer, do not use the $ sign). Question 4 2 pts Use your data table to report the Revenue if you sell 13,000 cases (When entering your answer, do not use the $ sign). Question 5 2 pts Refer to your Data Table. Report the volume in cell E20


