

Question: Fit Statistics Model Selection based on Valid: Misclassification Rate (_VMISC_) Train: Valid: Valid: Average Train: Average Selected Model Model Misclassification Squared Misclassification Squared Model Node
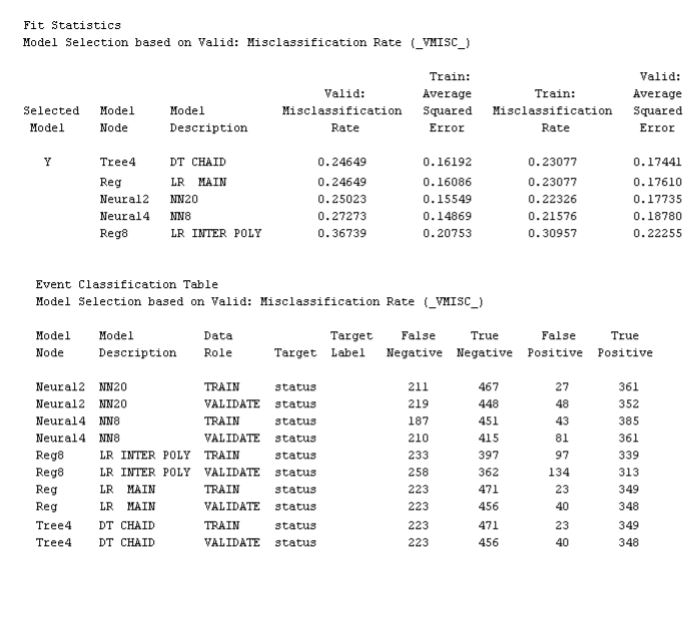
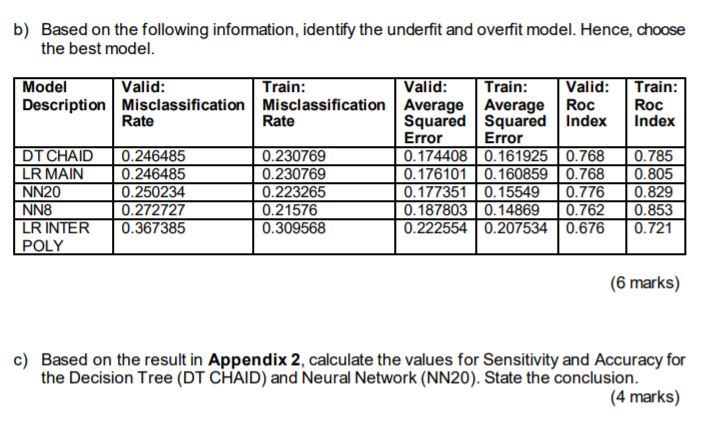
Fit Statistics Model Selection based on Valid: Misclassification Rate (_VMISC_) Train: Valid: Valid: Average Train: Average Selected Model Model Misclassification Squared Misclassification Squared Model Node Description Rate Error Rate Error Y Tree4 DT CHAID 0.24649 0. 16192 0. 23077 0. 17441 Reg LR MAIN 0.24649 0. 16086 0. 23077 0. 17610 Neural2 NN20 0. 25023 0. 15549 0. 22326 0. 17735 Neural4 NN8 0. 27273 0. 14869 0. 21576 0. 18780 Reg8 LR INTER POLY 0.36739 0. 20753 0. 30957 0. 22255 Event Classification Table Model Selection based on Valid: Misclassification Rate (_VMISC_) Model Model Data Target False True False True Node Description Role Target Label Negative Negative Positive Positive Neural2 NN20 TRAIN status 211 167 27 361 Neural2 NN20 VALIDATE status 219 148 48 352 Neural4 NN8 TRAIN status 187 451 43 385 Neural4 NN8 VALIDATE status 210 415 81 361 Reg8 LR INTER POLY TRAIN status 233 397 97 339 Reg8 LR INTER POLY VALIDATE status 258 362 134 313 Reg LR MAIN TRAIN status 223 471 23 349 Reg LR MAIN VALIDATE status 223 456 40 348 Tree4 DT CHAID TRAIN status 223 171 23 349 Tree4 DT CHAID VALIDATE status 223 456 40 348b) Based on the following information, identify the underfit and overfit model. Hence, choose the best model. Model Valid: Train: Valid: Train: Valid: Train: Description Misclassification Misclassification Average Average Roc Roc Rate Rate Squared Squared Index Index Error Error DT CHAID 0.246485 0.230769 0. 174408 0.161925 0.768 0.785 LR MAIN 0.246485 0.230769 0. 176101 0. 160859 0.768 0.805 NN20 0.250234 0.223265 0. 177351 0.15549 0.776 0.829 NN8 0.272727 0.21576 0. 187803 0.14869 0.762 0.853 LR INTER 0.367385 0.309568 0.222554 0.207534 0.676 0.721 POLY (6 marks) c) Based on the result in Appendix 2, calculate the values for Sensitivity and Accuracy for the Decision Tree (DT CHAID) and Neural Network (NN20). State the conclusion. (4 marks)
Step by Step Solution
There are 3 Steps involved in it

Get step-by-step solutions from verified subject matter experts