

Question: Hello, Can you please help me to understand this logistic regression? This is a fraudulent claim dataset, and I need to examine the results. Thank
Hello,
Can you please help me to understand this logistic regression?
This is a fraudulent claim dataset, and I need to examine the results.
Thank you very much.
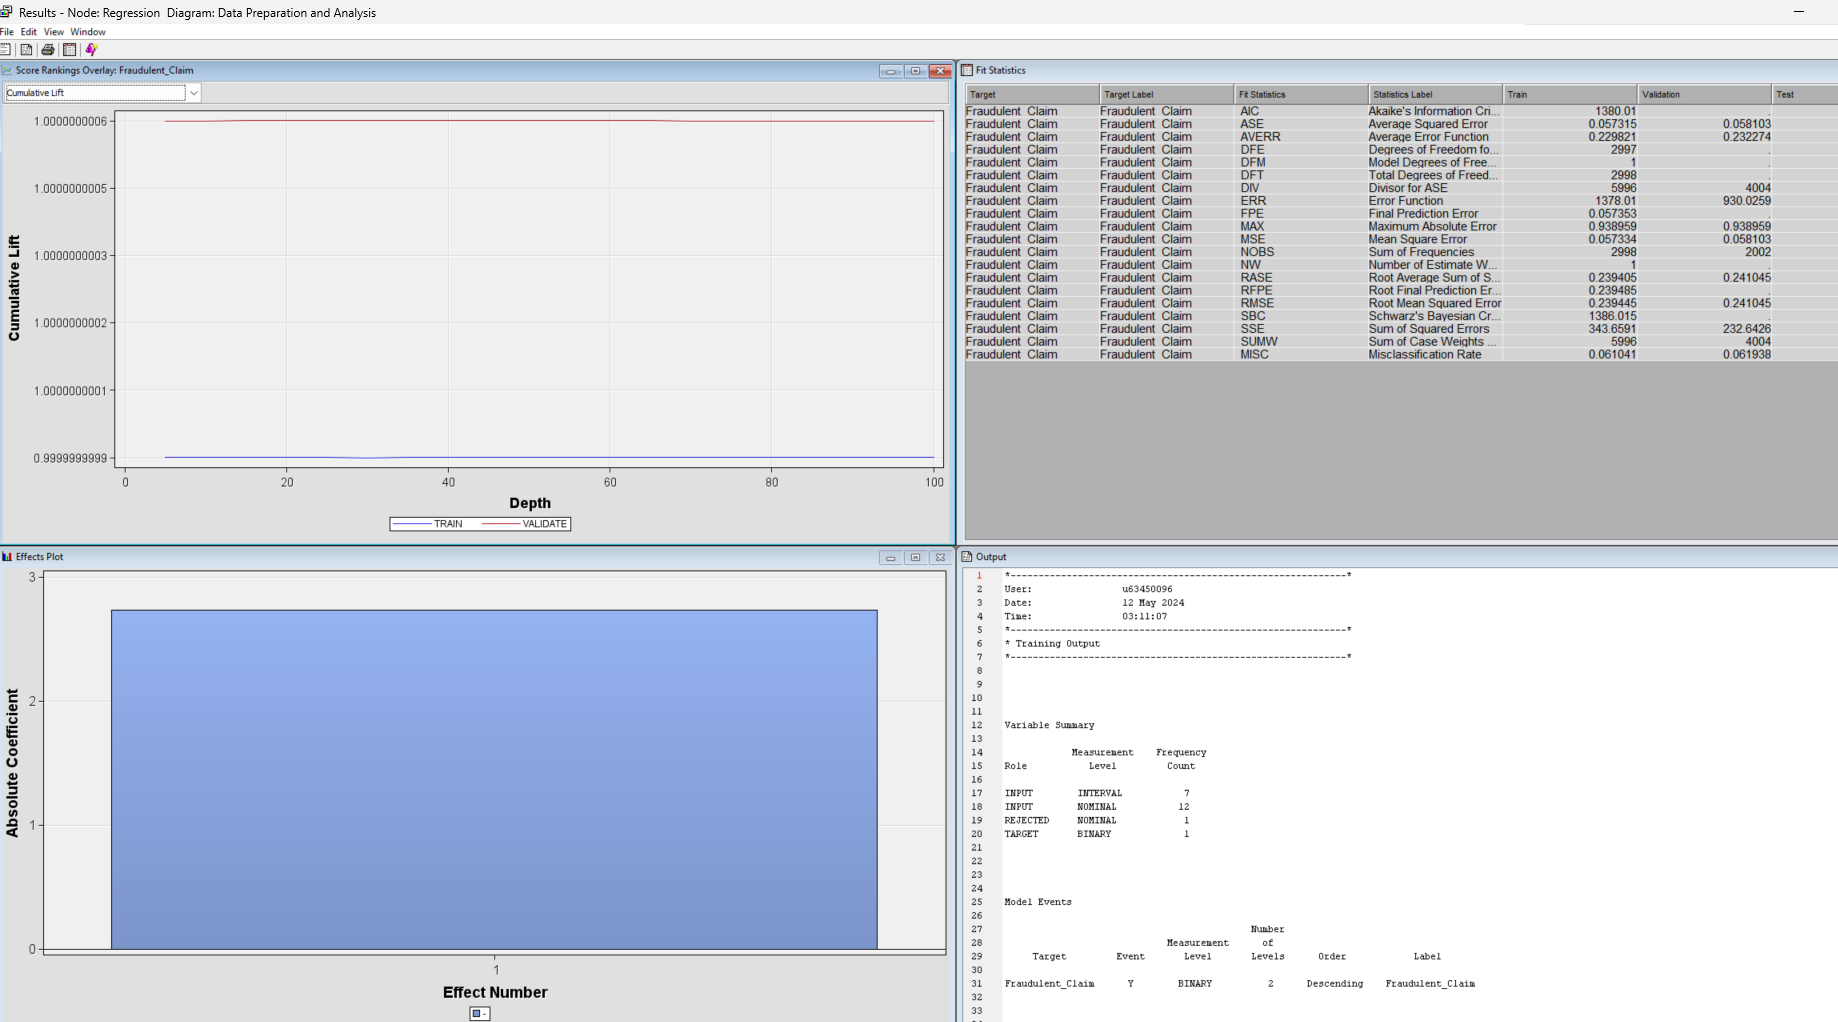
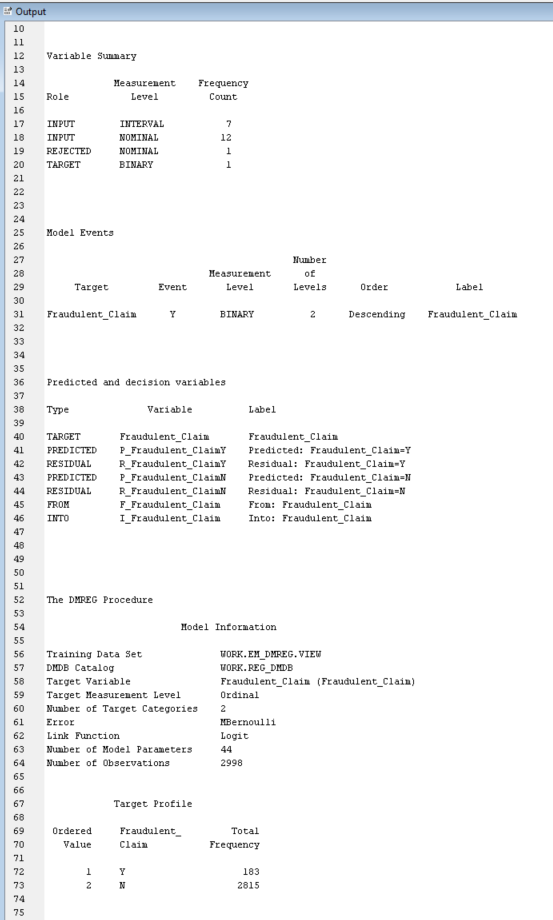
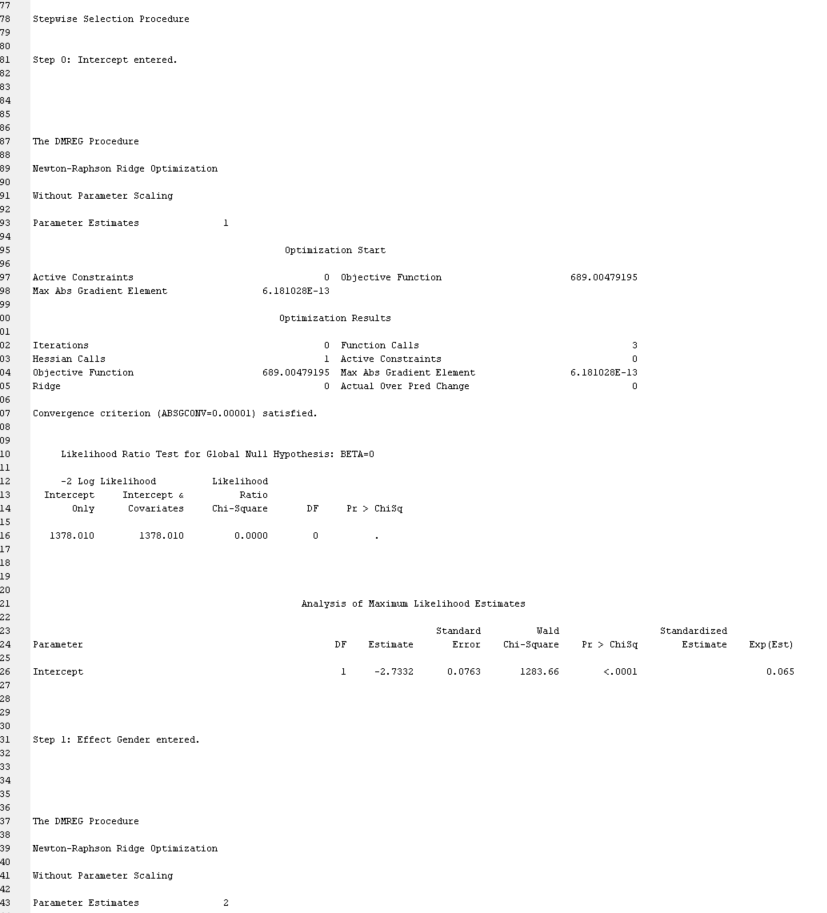
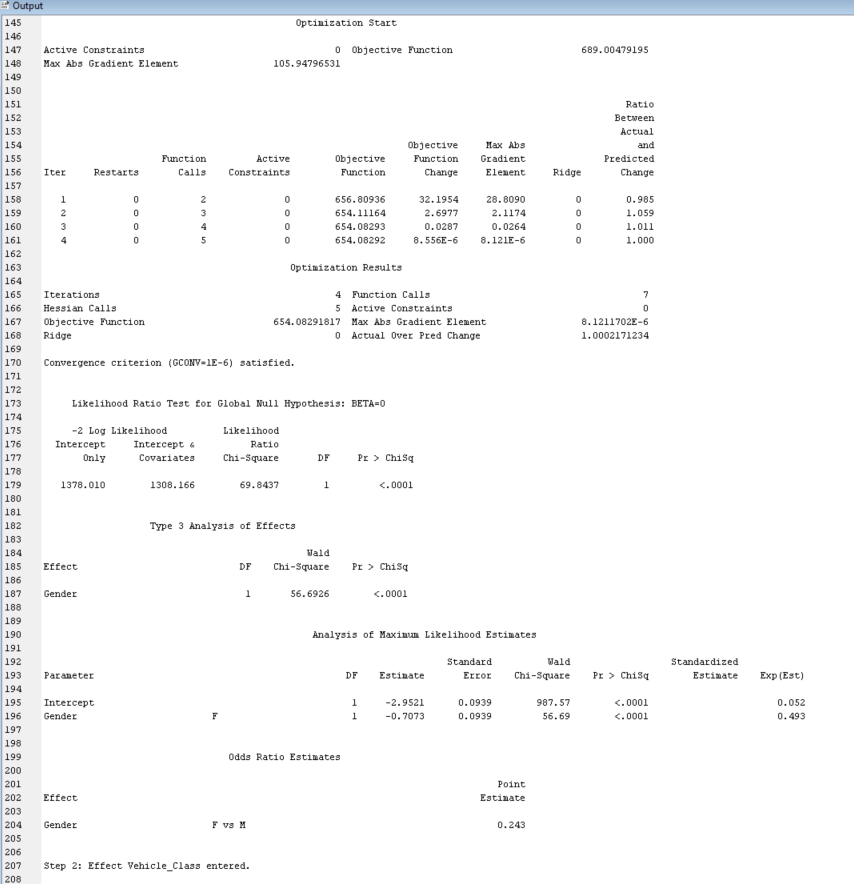
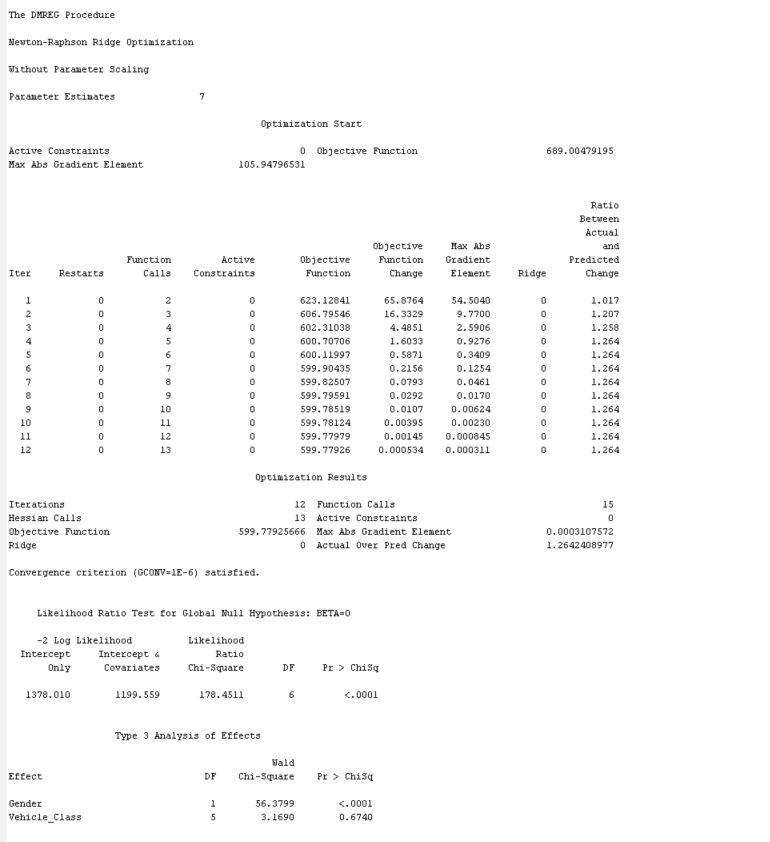
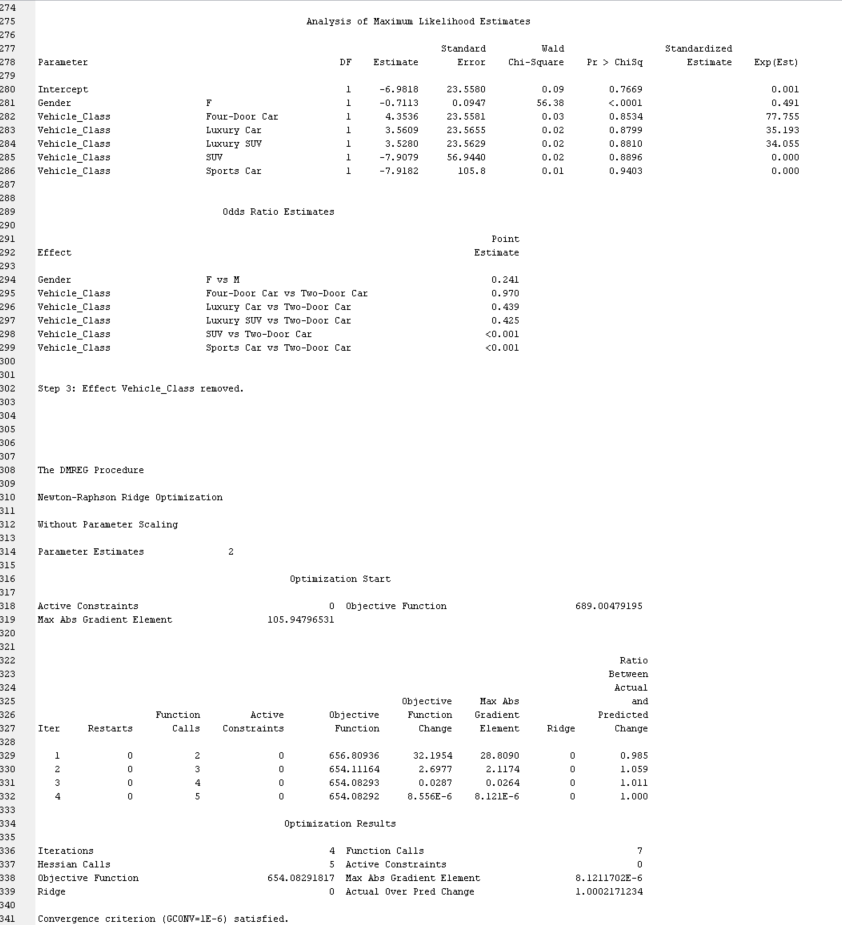
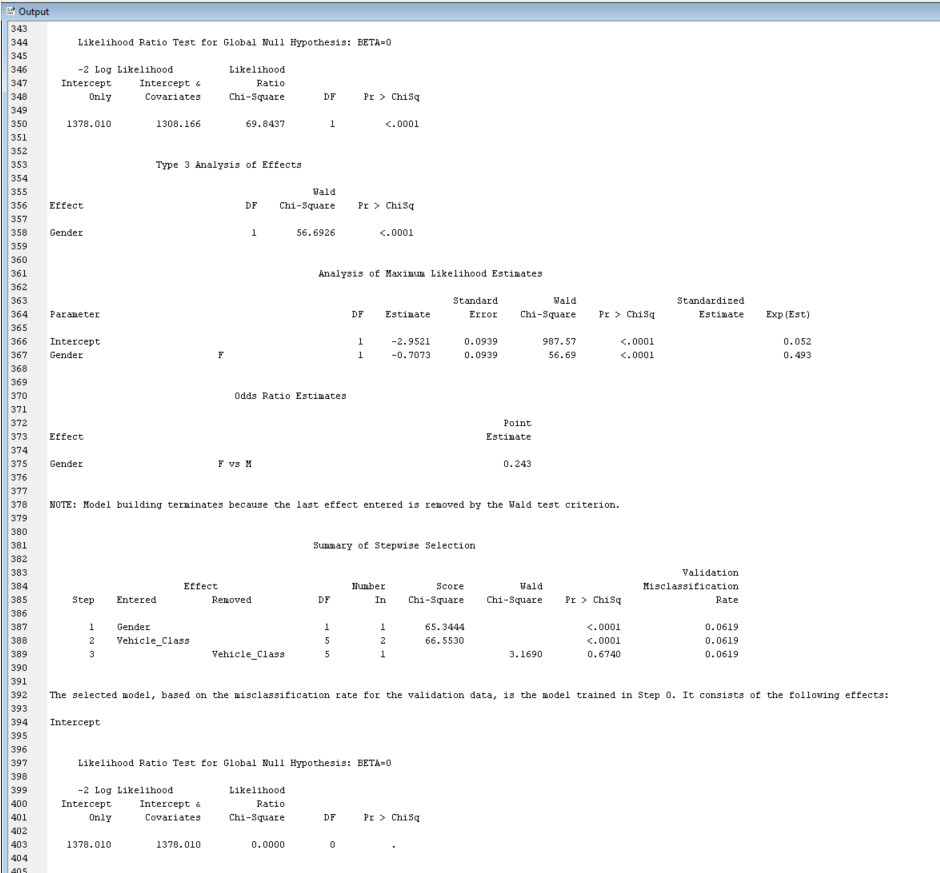
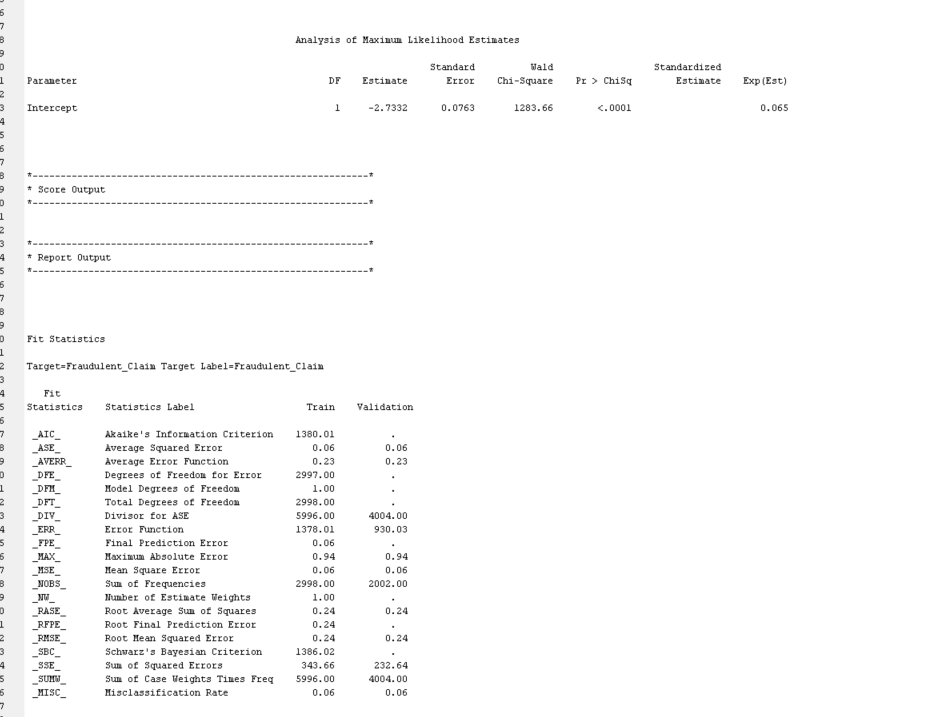
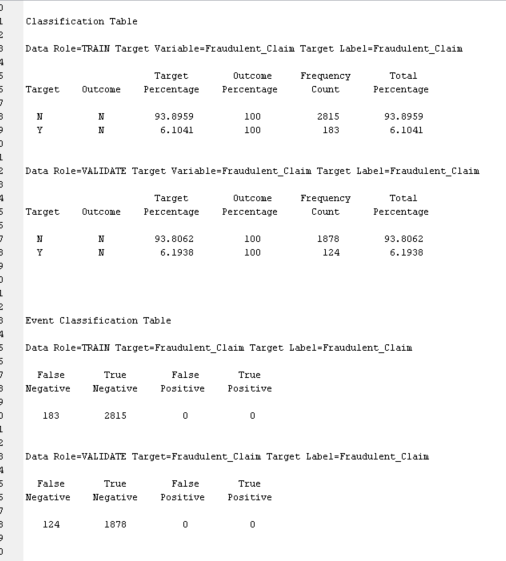
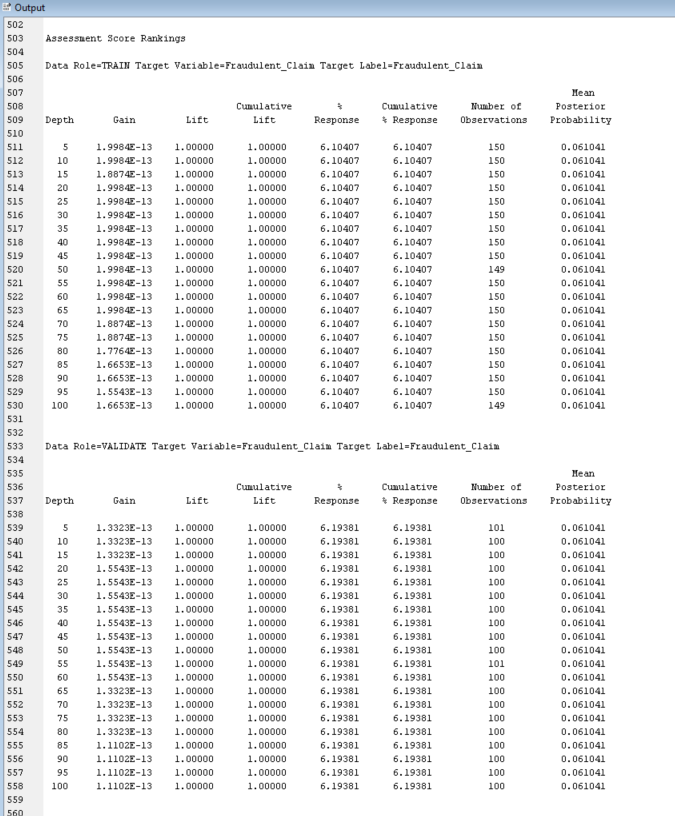
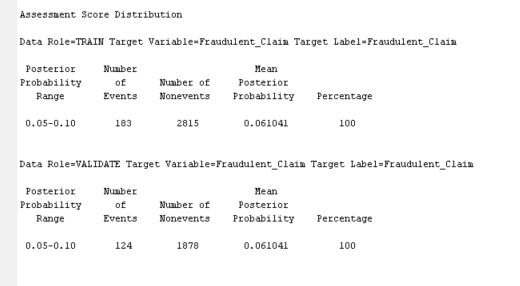
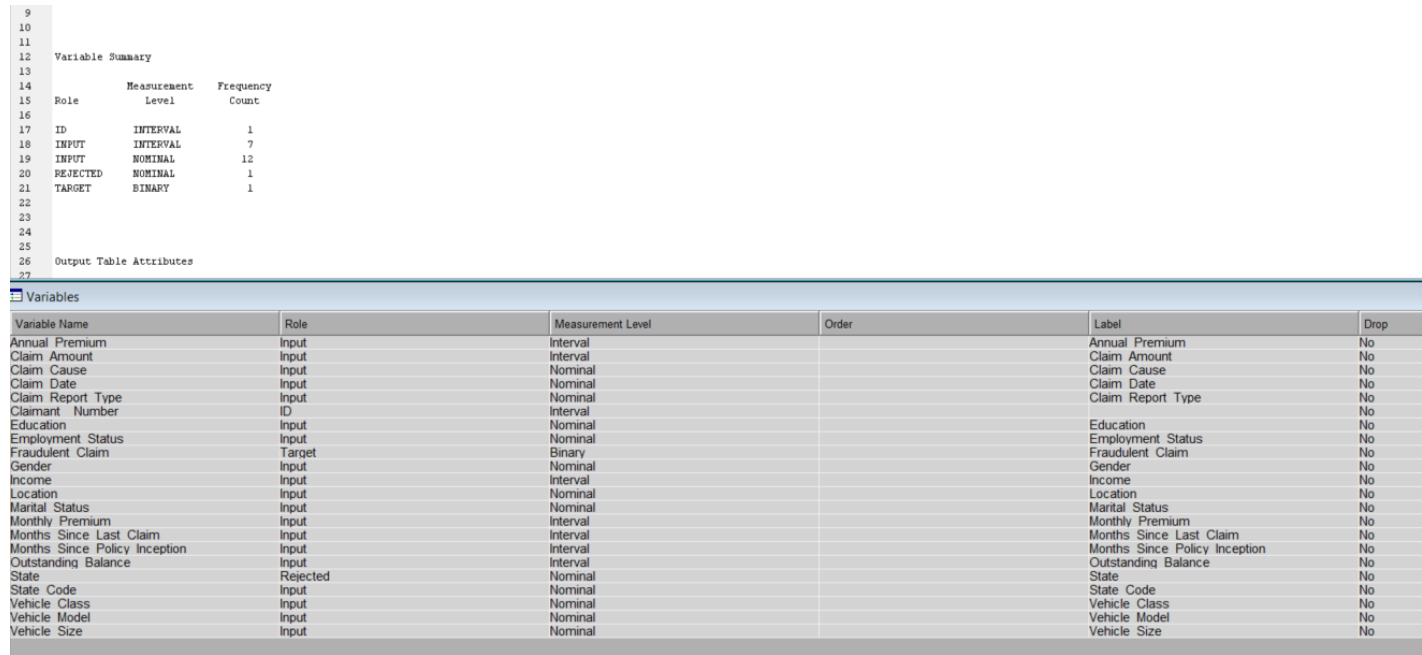
Results - Node: Regression Diagram: Data Preparation and Analysis ile Edit View Window Score Rankings Overlay: Fraudulent_Claim O X Fit Statistics Cumulative Lift Target Target Label FR Statistics Statistics Label Train Validation Test Fraudulent Claim Fraudulent Claim AIC Akaike's Information Cri 1380.01 1.0000000006 - Fraudulent Claim Fraudulent Claim ASE Average Squared Error 0.057315 0.058103 Fraudulent Claim Fraudulent Claim AVERR Average Error Function 0.229821 0.232274 Fraudulent Claim Fraudulent Claim DEE Degrees of Freedom fo. 2997 Fraudulent Claim Fraudulent Claim DFM Model Degrees of Free.. Fraudulent Claim Fraudulent Claim DET Total Degrees of Freed. 2998 Fraudulent Claim Fraudulent Claim DIV Divisor for ASE 5996 4004 1.0000000005 - Fraudulent Claim Fraudulent Cla ERR Error Function 1378.01 930.0259 Fraudulent Claim Fraudulent Claim FPE Final Prediction Error 0.057353 Fraudulent Claim Fraudulent Claim MAX Maximum Absolute Error 0.938959 0.938959 Fraudulent Claim Fraudulent Claim MSE Mean Square Error 0.057334 0.058103 Fraudulent Claim Fraudulent Claim NOBS Sum of Frequencies 2998 2002 1.0000000003 - Fraudulent Claim Fraudulent Clai NW Number of Estimate W.. Fraudulent Claim Fraudulent Claim RASE Root Average Sum of S.. 0.239405 0.241045 RFPE 0.239485 Cumulative Lift Fraudulent Claim Fraudulent Claim Root Final Prediction Er. Fraudulent Claim Fraudulent Claim RMSE Root Mean Squared Error 0.239445 0.241045 Fraudulent Claim Fraudulent Claim SBC Schwarz's Bayesian Cr.. 1386.015 1.0000000002 - Fraudulent Claim Fraudulent Claim SSE Sum of Squared Errors 343.6591 232.6426 Fraudulent Claim Fraudulent Claim SUMW Sum of Case Weights . 5996 4004 Fraudulent Claim Fraudulent Claim MISC Misclassification Rate 0.061041 0.061938 1.0000000001 - 0.9999999999 20 40 60 80 100 Depth TRAIN - VALIDATE Ill Effects Plot - Q X Output User: 463450096 Date: 12 May 2024 Time 03: 11:07 * Training Output 9 10 11 12 Variable Summary 13 14 Measurement Frequency Absolute Coefficient 15 Role Level Count 16 17 INPUT INTERVAL 18 INPUT NOMINAL 12 REJECTED NOMINAL TARGET BINARY Model Events Number Measurement of Target Event Level Levels Order Label Fraudulent_Claim BINARY Descending Fraudulent_Claim Effect NumberOutput 10 11 12 Variable Summary 13 14 Measurement Frequency 15 Role Level Count 16 17 INPUT INTERVAL 7 18 INPUT NOMINAL 12 19 REJECTED NOMINAL 20 TARGET BINARY 21 22 23 24 25 Model Events 26 27 Number 28 Measurement 29 Target Event Level Levels Order Label 30 31 Fraudulent_Claim Y BINARY 2 Descending Fraudulent_Claim 32 33 34 35 36 Predicted and decision variables 37 38 Type Variable Label 39 40 TARGET Fraudulent_Claim Fraudulent_Claim 41 PREDICTED P_Fraudulent_ClaimY Predicted: Fraudulent_Claim=Y 42 RESIDUAL R_Fraudulent_ClaimY Residual: Fraudulent_Claim-Y 43 PREDICTED P_Fraudulent_ClaimN Predicted: Fraudulent_Claim=N 44 RESIDUAL R_Fraudulent_ClaimN Residual: Fraudulent_Claim=N 45 FROM F_Fraudulent_Claim From: Fraudulent_Claim 46 INTO I_Fraudulent_Claim Into: Fraudulent_Claim 47 48 49 50 51 52 The DMREG Procedure 53 54 Model Information 55 56 Training Data Set WORK. EM_DMREG. VIEW 57 DIDB Catalog WORK. REG_DNDB 58 Target Variable Fraudulent_Claim (Fraudulent_Claim) 59 Target Measurement Level Ordinal 60 Number of Target Categories 2 61 Error MBernoulli 62 Link Function Logit 63 Number of Model Parameters 44 64 Number of Observations 2998 65 66 67 Target Profile 68 69 Ordered Fraudulent_ Total 70 Value Claim Frequency 71 72 183 73 2815 74 75Stepwise Selection Procedure Step 0: Intercept entered. The DMREG Procedure Newton-Raphson Ridge Optimization Without Parameter Scaling Parameter Estimates Optimization Start Active Constraints 0 Objective Function 689. 00479195 Max Abs Gradient Element 6. 181028E-13 Optimization Results Iterations 0 Function Calls Hessian Calls 1 Active Constraints Objective Function 689. 00479195 Max Abs Gradient Element 6. 181028E-13 Ridge 0 Actual Over Pred Change Convergence criterion (ABSGCONV=0. 00001) satisfied. Likelihood Ratio Test for Global Null Hypothesis: BETA=0 -2 Log Likelihood Likelihood Intercept Intercept & Ratio inly Covariates Chi-Square OF Pr > Chisa 1378. 010 1378. 010 0.0000 Analysis of Maximum Likelihood Estimates Standard Wald Standardized Parameter DF Estimate Error Chi-Square Pr > Chisq Estimate Exp (Est) Intercept 1 -2. 7332 0. 0763 1283.66 <. step effect gender entered. the dmreg procedure newton-raphson ridge optimization without parameter scaling estimatesoutput start active constraints objective function max abs gradient element ratio between actual hax and predicted iter restarts calls change un h wn results iterations hessian aba ridg over pred convergence criterion satisfied. likelihood test for global null hypothesis: beta="0" log intercept only covariates chi-square df pr> Chisq 178 179 1378. 010 1308. 166 59. 8437 <.0001 type analysis of effects wald effect chi-square pr> Chisq 186 187 Gender 1 56. 6926 C. 0001 188 189 190 Analysis of Maximum Likelihood Estimates 191 192 Standard Wald Standardized 193 Parameter DF Estimate Error Chi-Square Pr > Chisq Estimate Exp (Est) 194 195 Intercept -2. 9521 0. 0939 987.57 <.0001 gender f odds ratio estimates coo point effect estimate va m step vehicle_class entered. dmreg procedure newton-raphson ridge optimization without parameter scaling start active constraints objective function max abs gradient element between actual hax and predicted iter restarts calls change d. results iterations hessian over pred convergence criterion satisfied. likelihood test for global null hypothesis: beta="0" log intercept only covariates chi-square df pr> Chisq 1378.010 1199. 559 178. 4511 6 C.0001 Type 3 Analysis of Effects Wald Effect DF Chi-Square Pr > Chisq Gender 56.3799 <.0001 vehicle class of maximum likelihood estimates standard wald standardized parameter df estimate error chi-square pr> Chisq Estimate Exp (Est) 179 280 Intercept -6.9818 23. 5580 0. 09 0. 7669 0. 001 281 Gender 0. 7113 0. 0947 56.38 <. vehicle_class four-door car luxury suv d. sports odds ratio estimates point effect estimate gender f va m vs two-door co. step removed. the dmreg procedure newton-raphson ridge optimization without parameter scaling start active constraints objective function max abs gradient element between actual hax and predicted iter restarts calls change results iterations hessian over pred tion satisfieoutput likelihood test for global null hypothesis: beta="0" log intercept s only covariates chi-square df pr> Chisq |349 350 1378. 010 1308. 166 69.8437 <. type analysis of effects wald effect df chi-square pr> Chisq |357 358 Gender 56. 6926 <.0001 analysis of maximum likelihood estimates standard wald standardized parameter estimate error chi-square pr> Chisq Estimate Exp (Est) 365 366 Intercept -2. 9521 0. 0939 987.57 <. gender f odds ratio estimates point effect estimate va m note: model building terminates because the last entered is removed by wald test criterion. summary of stepvise selection validation number score misclassification step de in chi-square pr> Chisq Rate 386 387 Gender 65.3444 C. 0001 0. 0619 388 WN Vehicle_Class 66.5530 C. 0001 0. 0619 389 Vehicle_Class 3. 1690 0. 6740 0. 0619 390 391 392 The selected model, based on the misclassification rate for the validation data, is the model trained in Step 0. It consists of the following effects: 393 394 Intercept 395 1396 397 Likelihood Ratio Test for Global Null Hypothesis: BETA=0 398 399 -2 Log Likelihood Likelihood 400 Intercept Intercept Ratio 401 Only Covariates Chi-Square OF Px > Chisq 402 403 1378. 010 1376. 010 0.0000 404Analysis of Maximum Likelihood Estimates Standard Wald Standardized Parameter DF Estimate Error Chi-Square Pr > Chisq Estimate Exp (Est) Intercept 1 -2. 7332 0. 0763 1283. 66 <.0001 score output report fit statistics target="Fraudulent_Claim" label="Fraudulent_Claim" train validation aic akaike information criterion ase average squared error _averr function dfe degrees of freedom for dfh_ hodel _dft_ total div divisor _err_ fpe final prediction max_ maximum absolute hse mean square nobs sun frequencies nw number estimate weights rase root squares rfpe_ rmse sbc_ schwarz bayesian sse_ errors sunw sum case times freq _misc_ hisclassification rate table data role="TRAIN" variable="Fraudulent_Claim" outcome frequency percentage count variable-fraudulent_claim label-fraudulent_claim event classification role-train target-fraudulent_claim false true negative positive assessment rankings hean cunulative cumulative posterior depth gain lift response observations probability distribution label-fraudulent claim range events nonevents summary measurement level il interval input nominal rejected binary attributes variables order drop name annual premium no amount cause date type id claimant education employment status fraudulent gender income location marital monthly months since last policy inception outstanding balance state code vehicle class model size>
Step by Step Solution
There are 3 Steps involved in it

Get step-by-step solutions from verified subject matter experts