

Question: Fitting with a Line 10 points You are given a table with the percentage of 18-29 year olds in the United States that used social
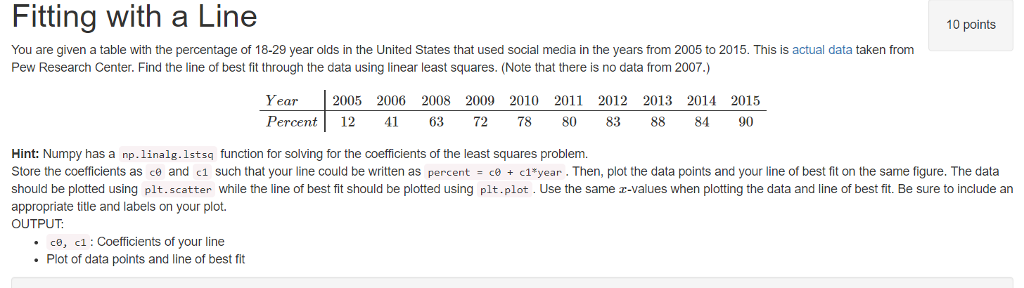
Fitting with a Line 10 points You are given a table with the percentage of 18-29 year olds in the United States that used social media in the years from 2005 to 2015. This is actual data taken from Pew Research Center. Find the line of best fit through the data using linear least squares. (Note that there is no data from 2007.) Year2005 2006 2008 2009 2010 2011 2012 2013 2014 2015 Percent12 1 63 72 78 80 83 88 84 90 Hint: Numpy has a np.linalg.lstsq function for solving for the coefficients of the least squares problem Store the coefficients as ce and c1 such that your line could be written as percent co c1*year . Then, plot the data points and your line of best fit on the same figure. The data should be plotted using plt.scatter while the line of best fit should be plotted using plt.plot . Use the same z-values when plotting the data and line of best fit. Be sure to include an appropriate title and labels on your plot OUTPUT: . c, c1:Coefficients of your line Plot of data points and line of best fit
Step by Step Solution
There are 3 Steps involved in it

Get step-by-step solutions from verified subject matter experts