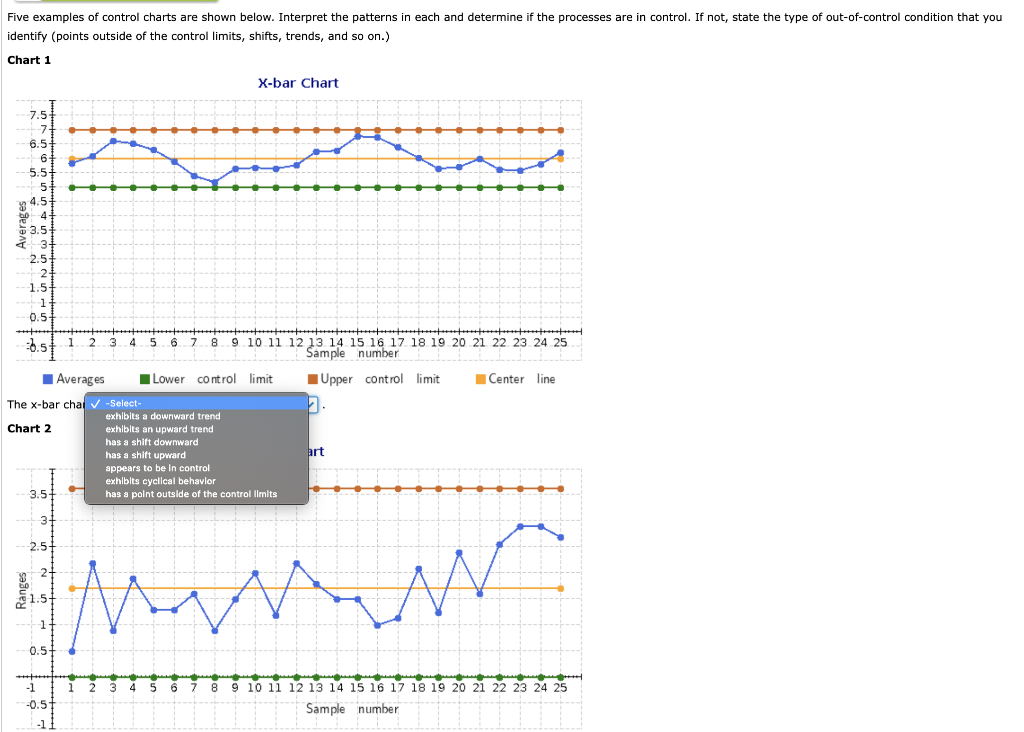
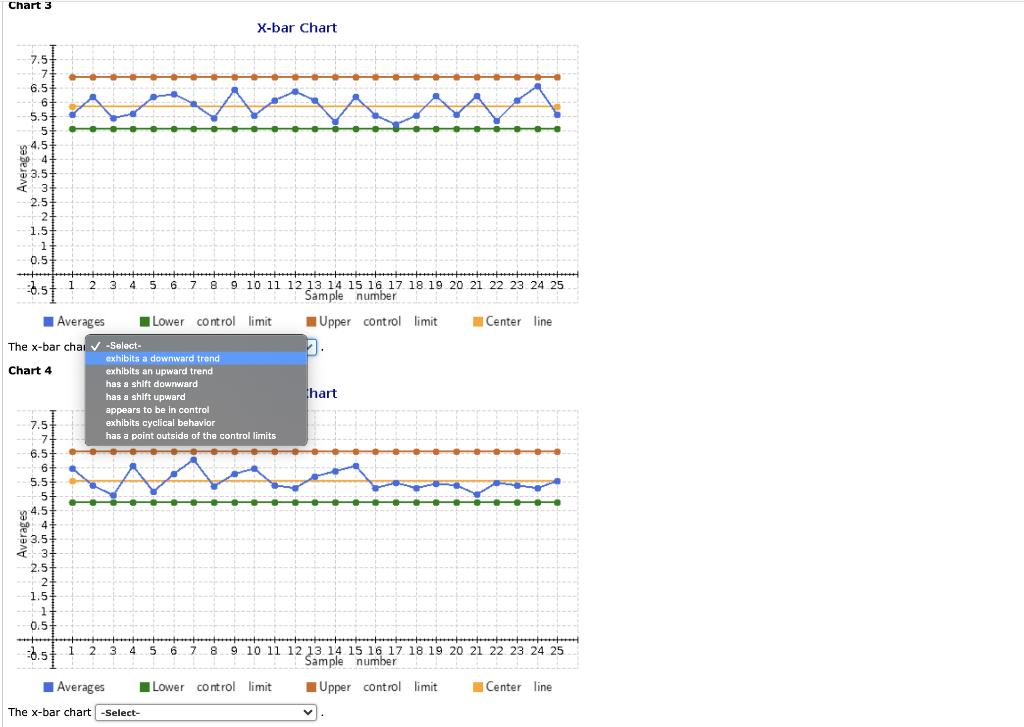
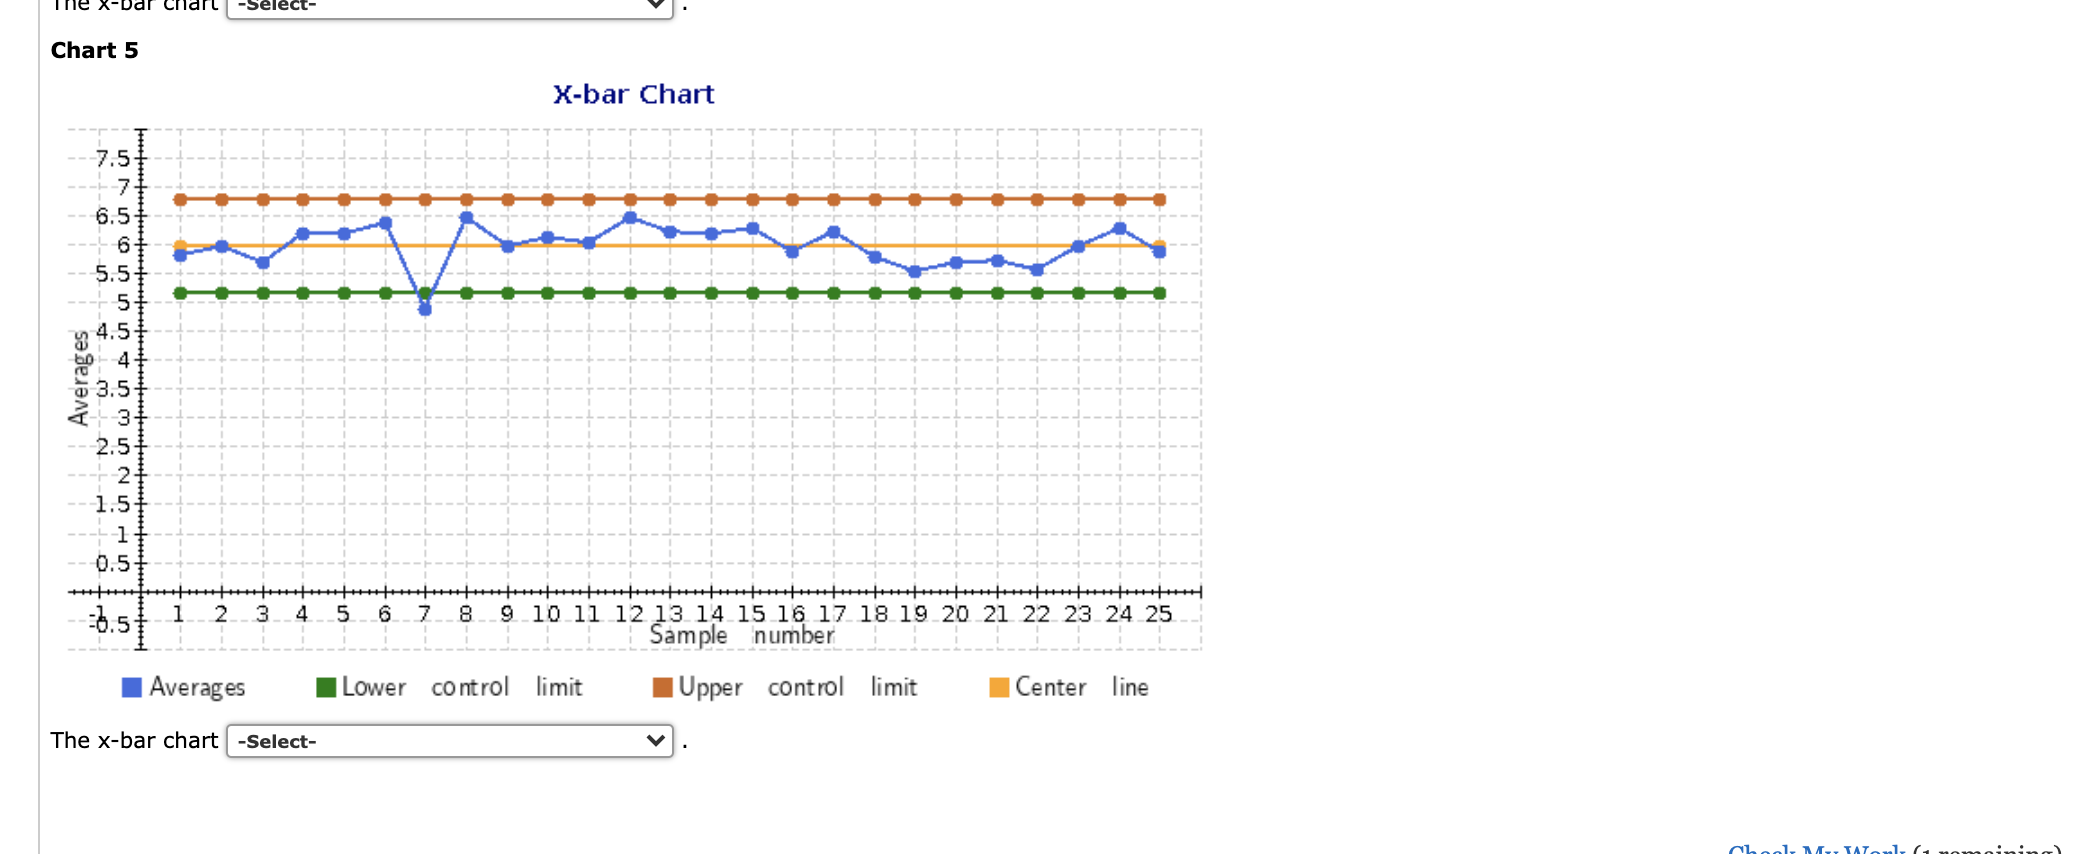
Question: Five examples of control charts are shown below. Interpret the patterns in each and determine if the processes are in control. If not, state the

Five examples of control charts are shown below.Five examples of control charts are shown below.Five examples of control charts are shown below.

Five examples of control charts are shown below. Interpret the patterns in each and determine if the processes are in control. If not, state the type of out-of-control condition that you identify (points outside of the control limits, shifts, trends, and so on.) Chart 1 X-bar Chart 7.5 7 6.5 6 5.5 5 4.5 04 3.5 3 2.5 2 1.5 1 0.5 1 -2.5 2 3 4 5 6 2 8 9 10 11 12 13 14 15 16 17 18 19 20 21 22 23 24 25 Sample number Averages Lower controllimit Upper controllimit Center line The X-bar chal -Select- exhibits a downward trend Chart 2 exhibits an upward trend has a shift downward has a shift upward appears to be in control exhibits cyclical behavior 3.5 has a point outside of the control limits art 3 2.5 ww 1.5 0.5+ 1 2 3 4 5 6 7 8 9 10 11 12 13 14 15 16 17 18 19 20 21 22 23 24 25 Sample number -0.5 -1 Chart 3 X-bar Chart 7.5 7 6.5 6 5.5 5 89 4.5 4 3.5

Step by Step Solution

There are 3 Steps involved in it

1 Expert Approved Answer
Step: 1 Unlock blur-text-image
Question Has Been Solved by an Expert!

Get step-by-step solutions from verified subject matter experts

Step: 2 Unlock
Step: 3 Unlock

Students Have Also Explored These Related General Management Questions!