

Question: Five histograms are presented below. Each histogram displays test scores on a scale of 0 to 10 for one of five different statistics classes. Place
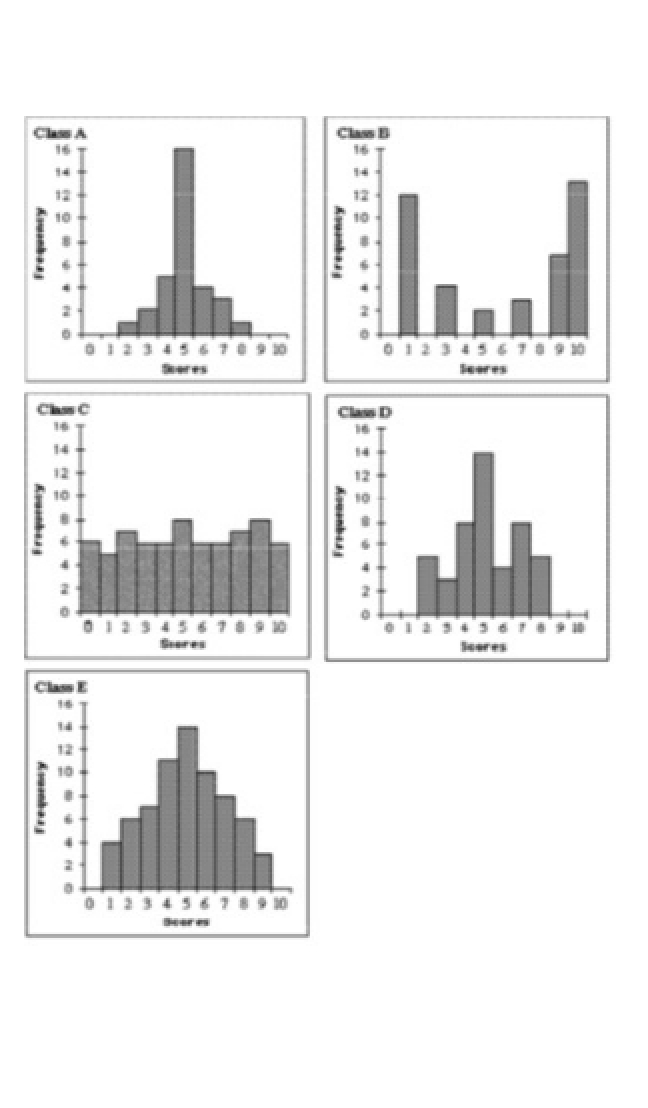
Five histograms are presented below. Each histogram displays test scores on a scale of 0 to 10 for one of five different statistics classes. Place the classes in order from the one having the least standard deviation to the one with highest. Explain your work.
\f
Step by Step Solution
There are 3 Steps involved in it
1 Expert Approved Answer
Step: 1 Unlock

Question Has Been Solved by an Expert!
Get step-by-step solutions from verified subject matter experts
Step: 2 Unlock
Step: 3 Unlock