

Question: Five normal distributions are plotted below. Their parameters (mean, standard deviation) are as follows (2, 0.5), (2, 1.5), (0, 0.5), (0, 1), (0, 2).
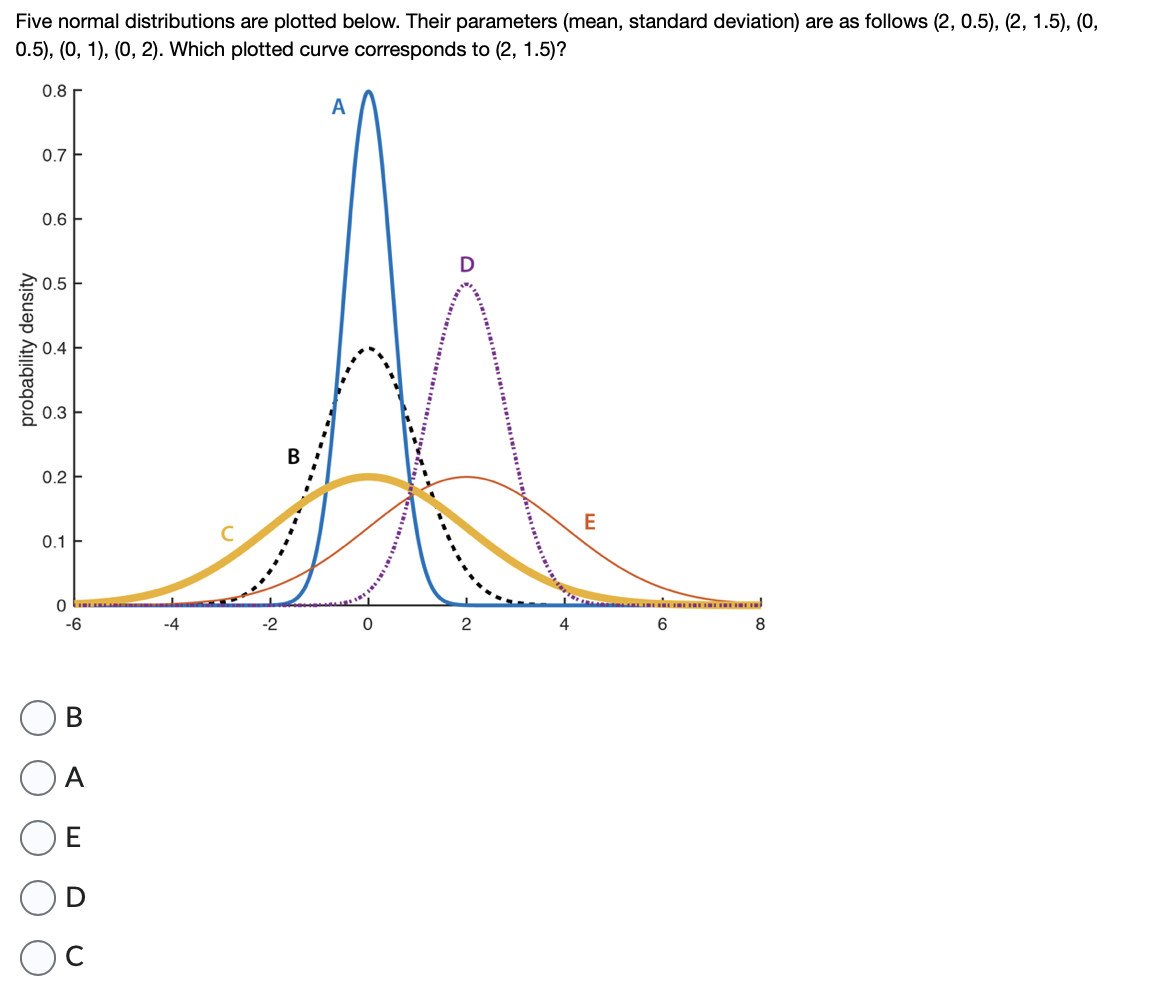
Five normal distributions are plotted below. Their parameters (mean, standard deviation) are as follows (2, 0.5), (2, 1.5), (0, 0.5), (0, 1), (0, 2). Which plotted curve corresponds to (2, 1.5)? probability density 0.8 0.7 0.6 0.5 0.4 0.3 0.2 0.1 0 -6 A D E -4 -2 0 2 4 6 8
Step by Step Solution
There are 3 Steps involved in it
1 Expert Approved Answer
Step: 1 Unlock

Question Has Been Solved by an Expert!
Get step-by-step solutions from verified subject matter experts
Step: 2 Unlock
Step: 3 Unlock