

Question: Q. The first plot will be easy, but the second will be more difficult to do. First plot a standard normal, then we'll see what
Q. The first plot will be easy, but the second will be more difficult to do.
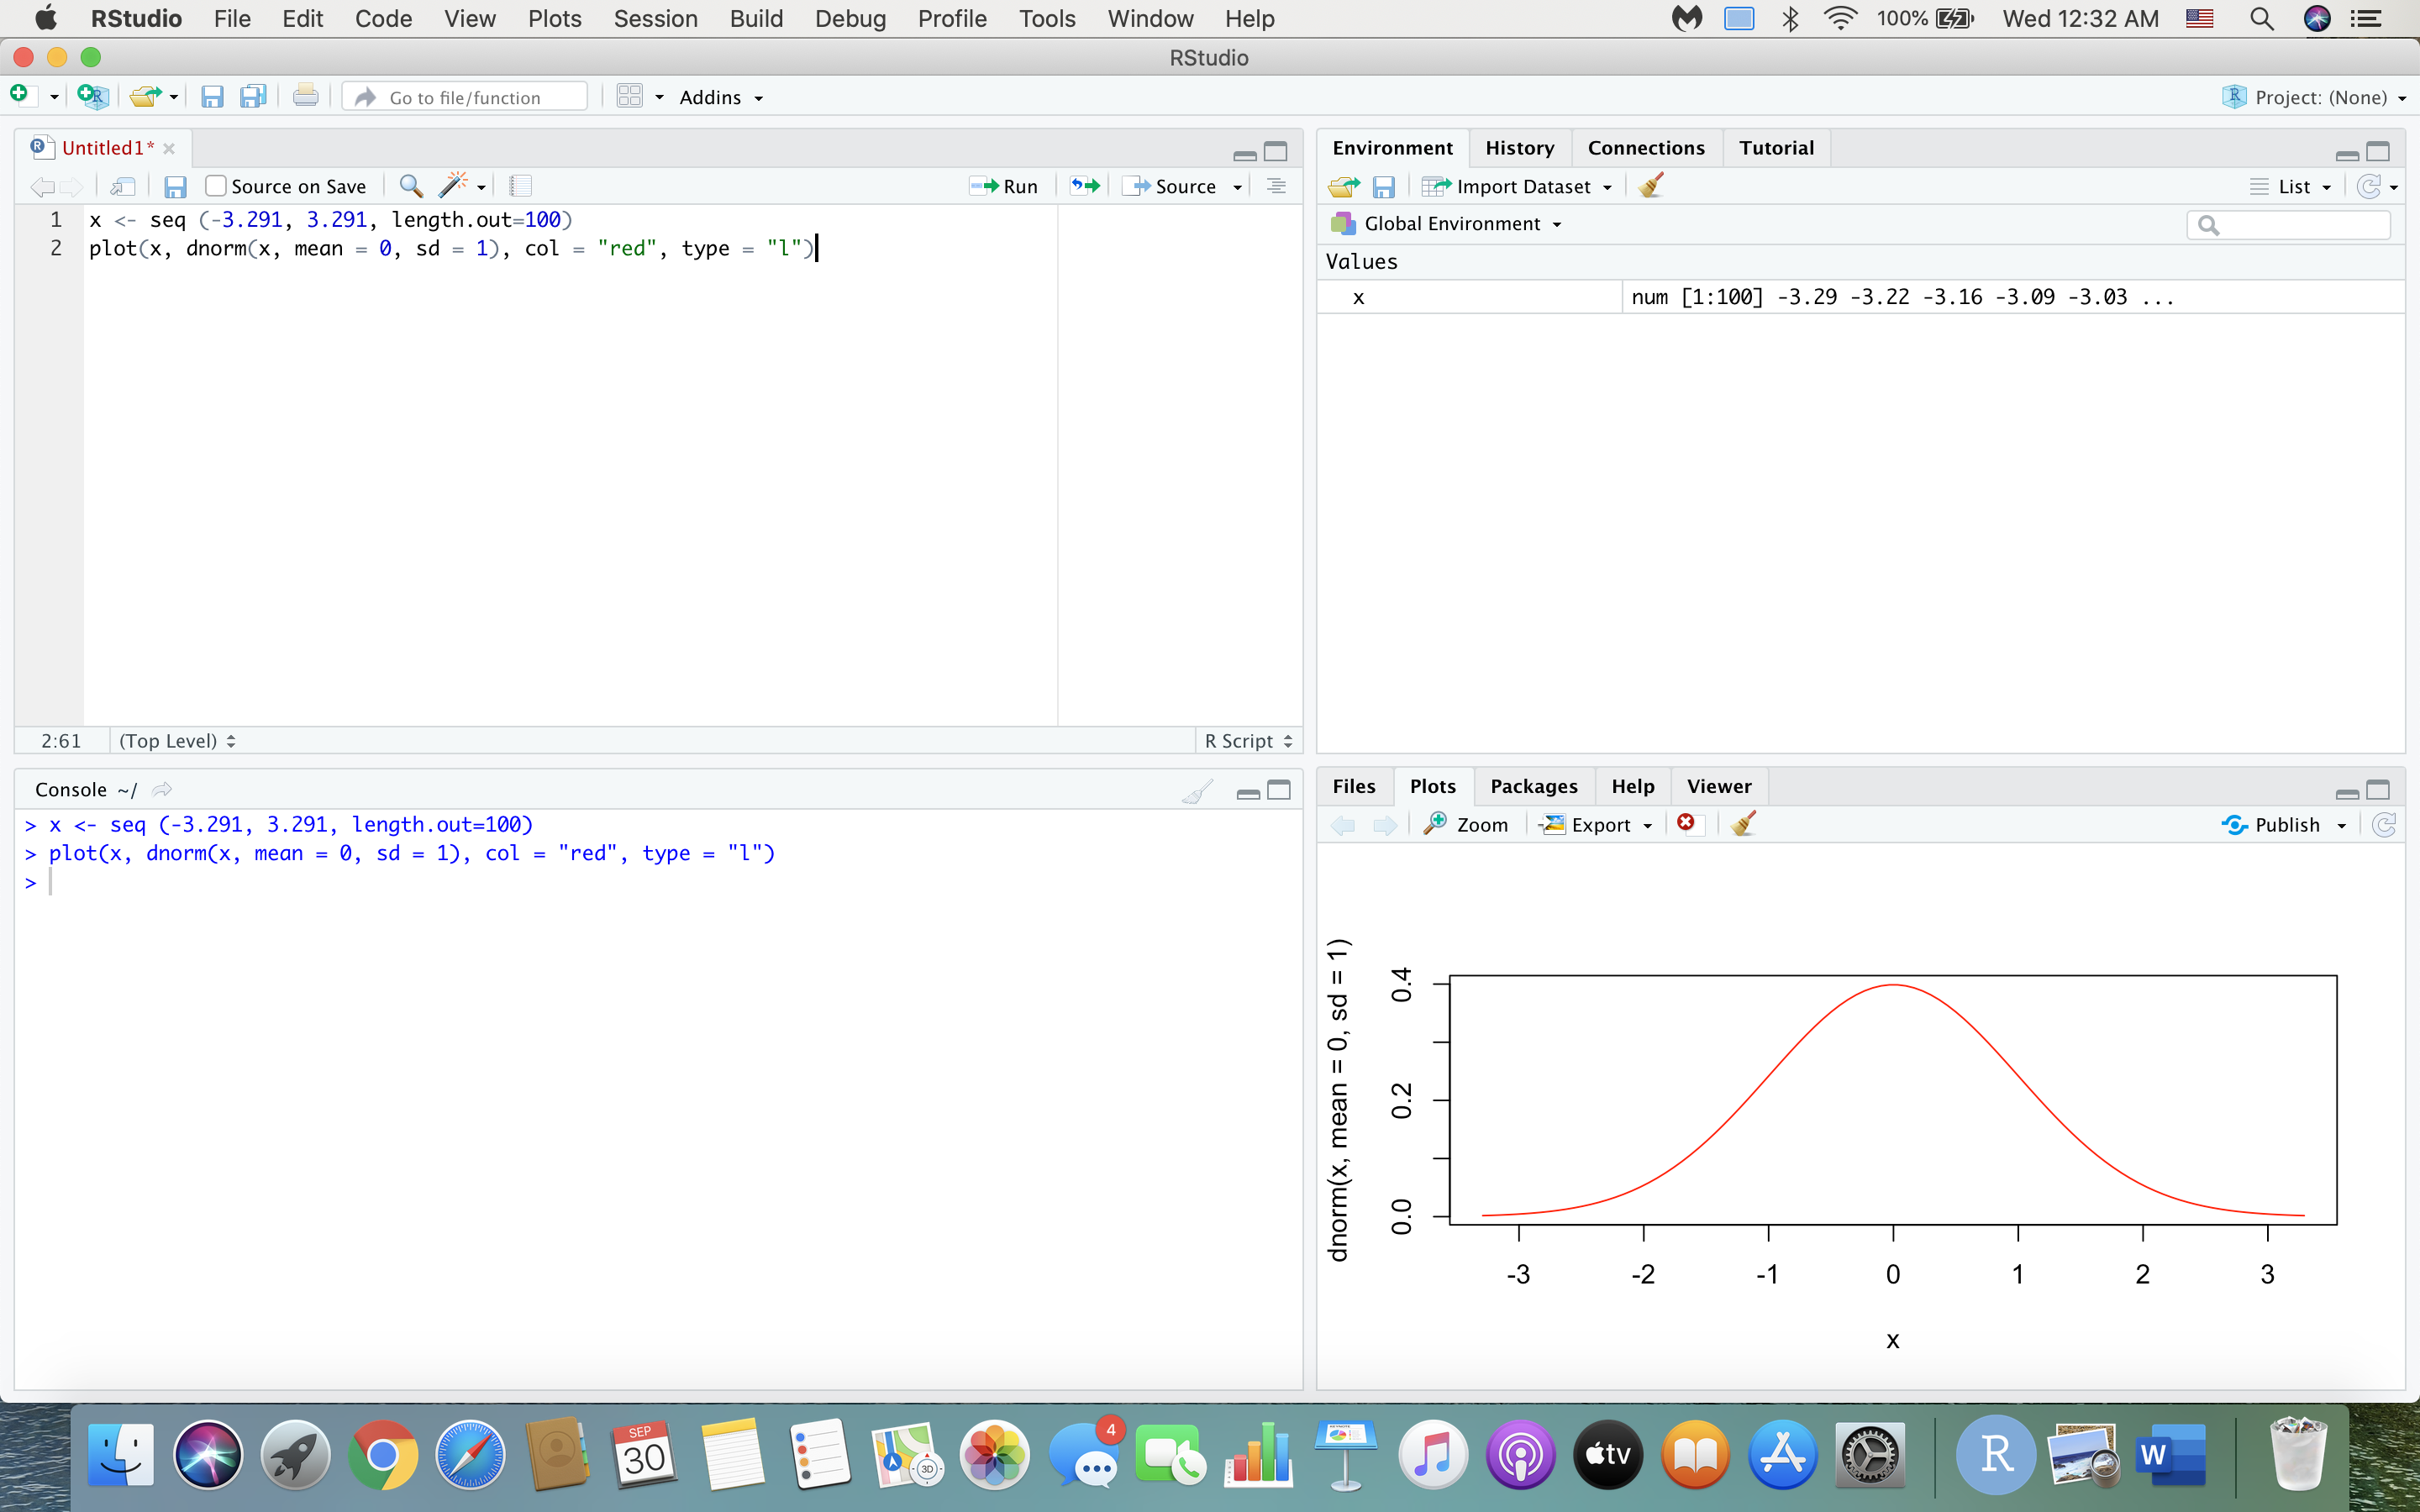
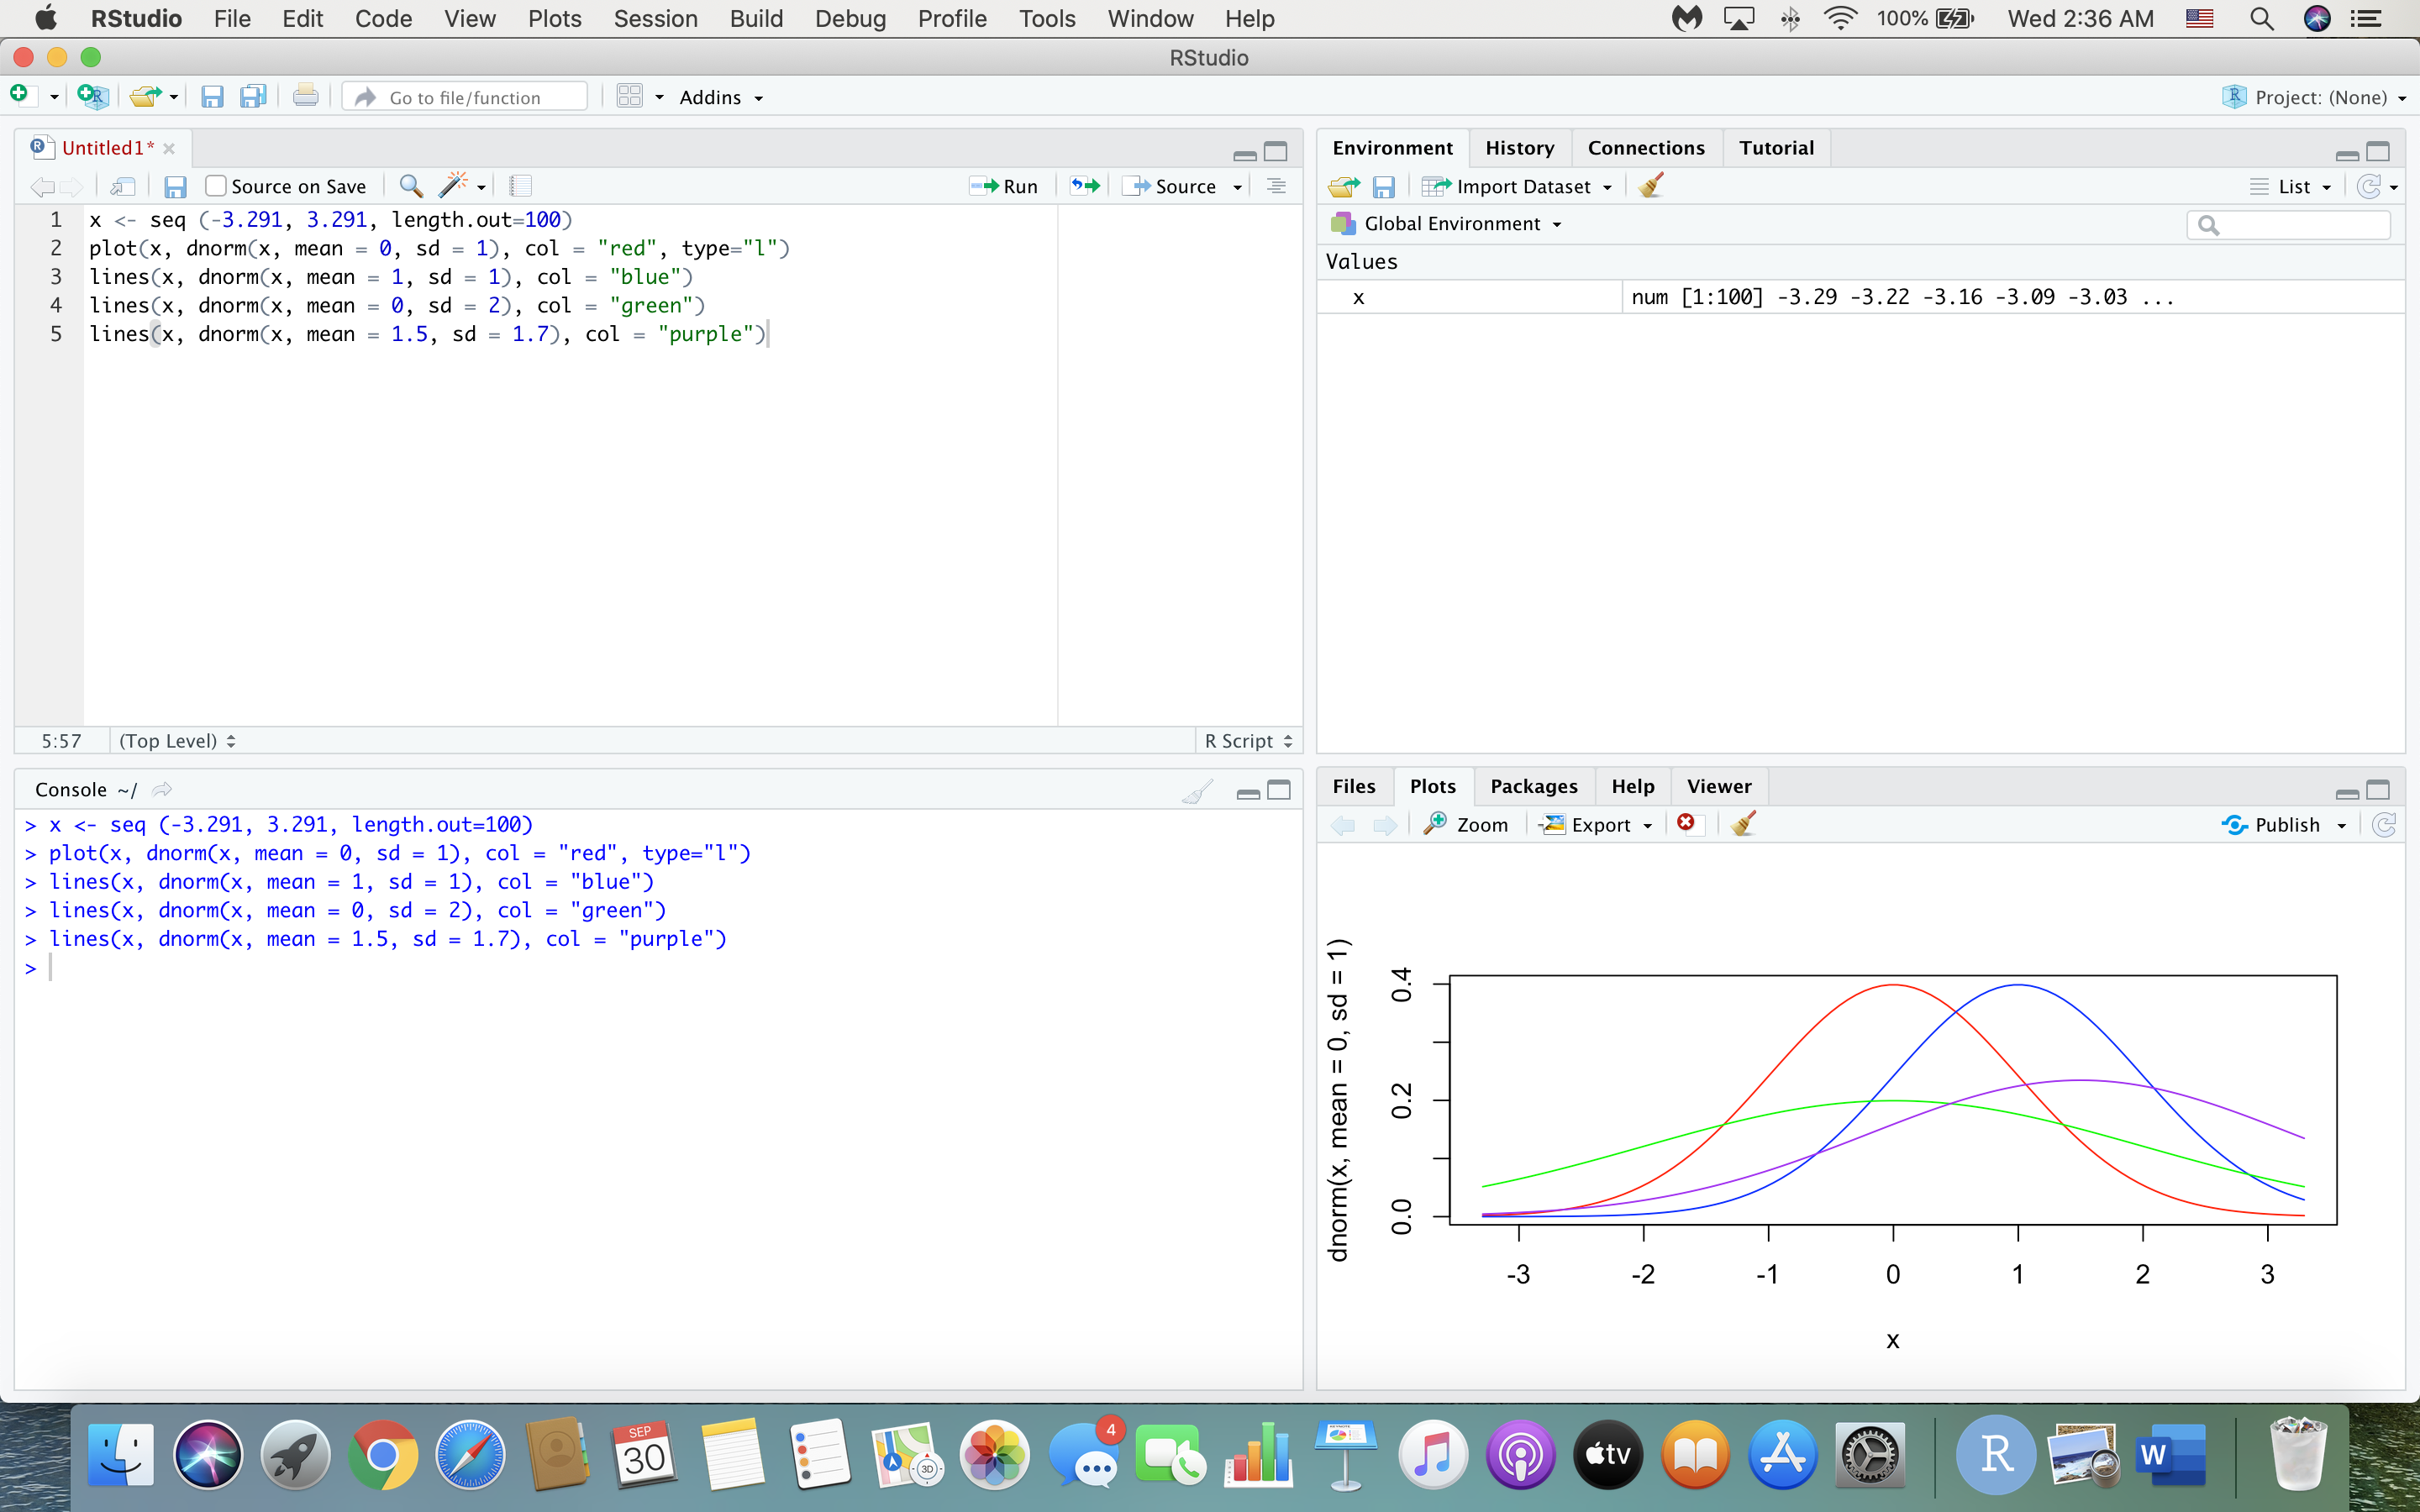
First plot a standard normal, then we'll see what happens if we change the parameters.
- x
- plot(x, dnorm(x, mean = 0, sd = 1), col = "red", type = "l") "plot" is a command to generate graphs (it's quite versatile, and we can't explain everything here). "dnorm" is essentially the equation for the normal distribution. This command will plot x and the value of x at each of the 100 points using the normal equation. The "mean", "sd" and "col" functions should be self-explanatory. type = "l" (that's lower case "L", not "one") generates lines instead of points (try it without type = "l" to see the difference).
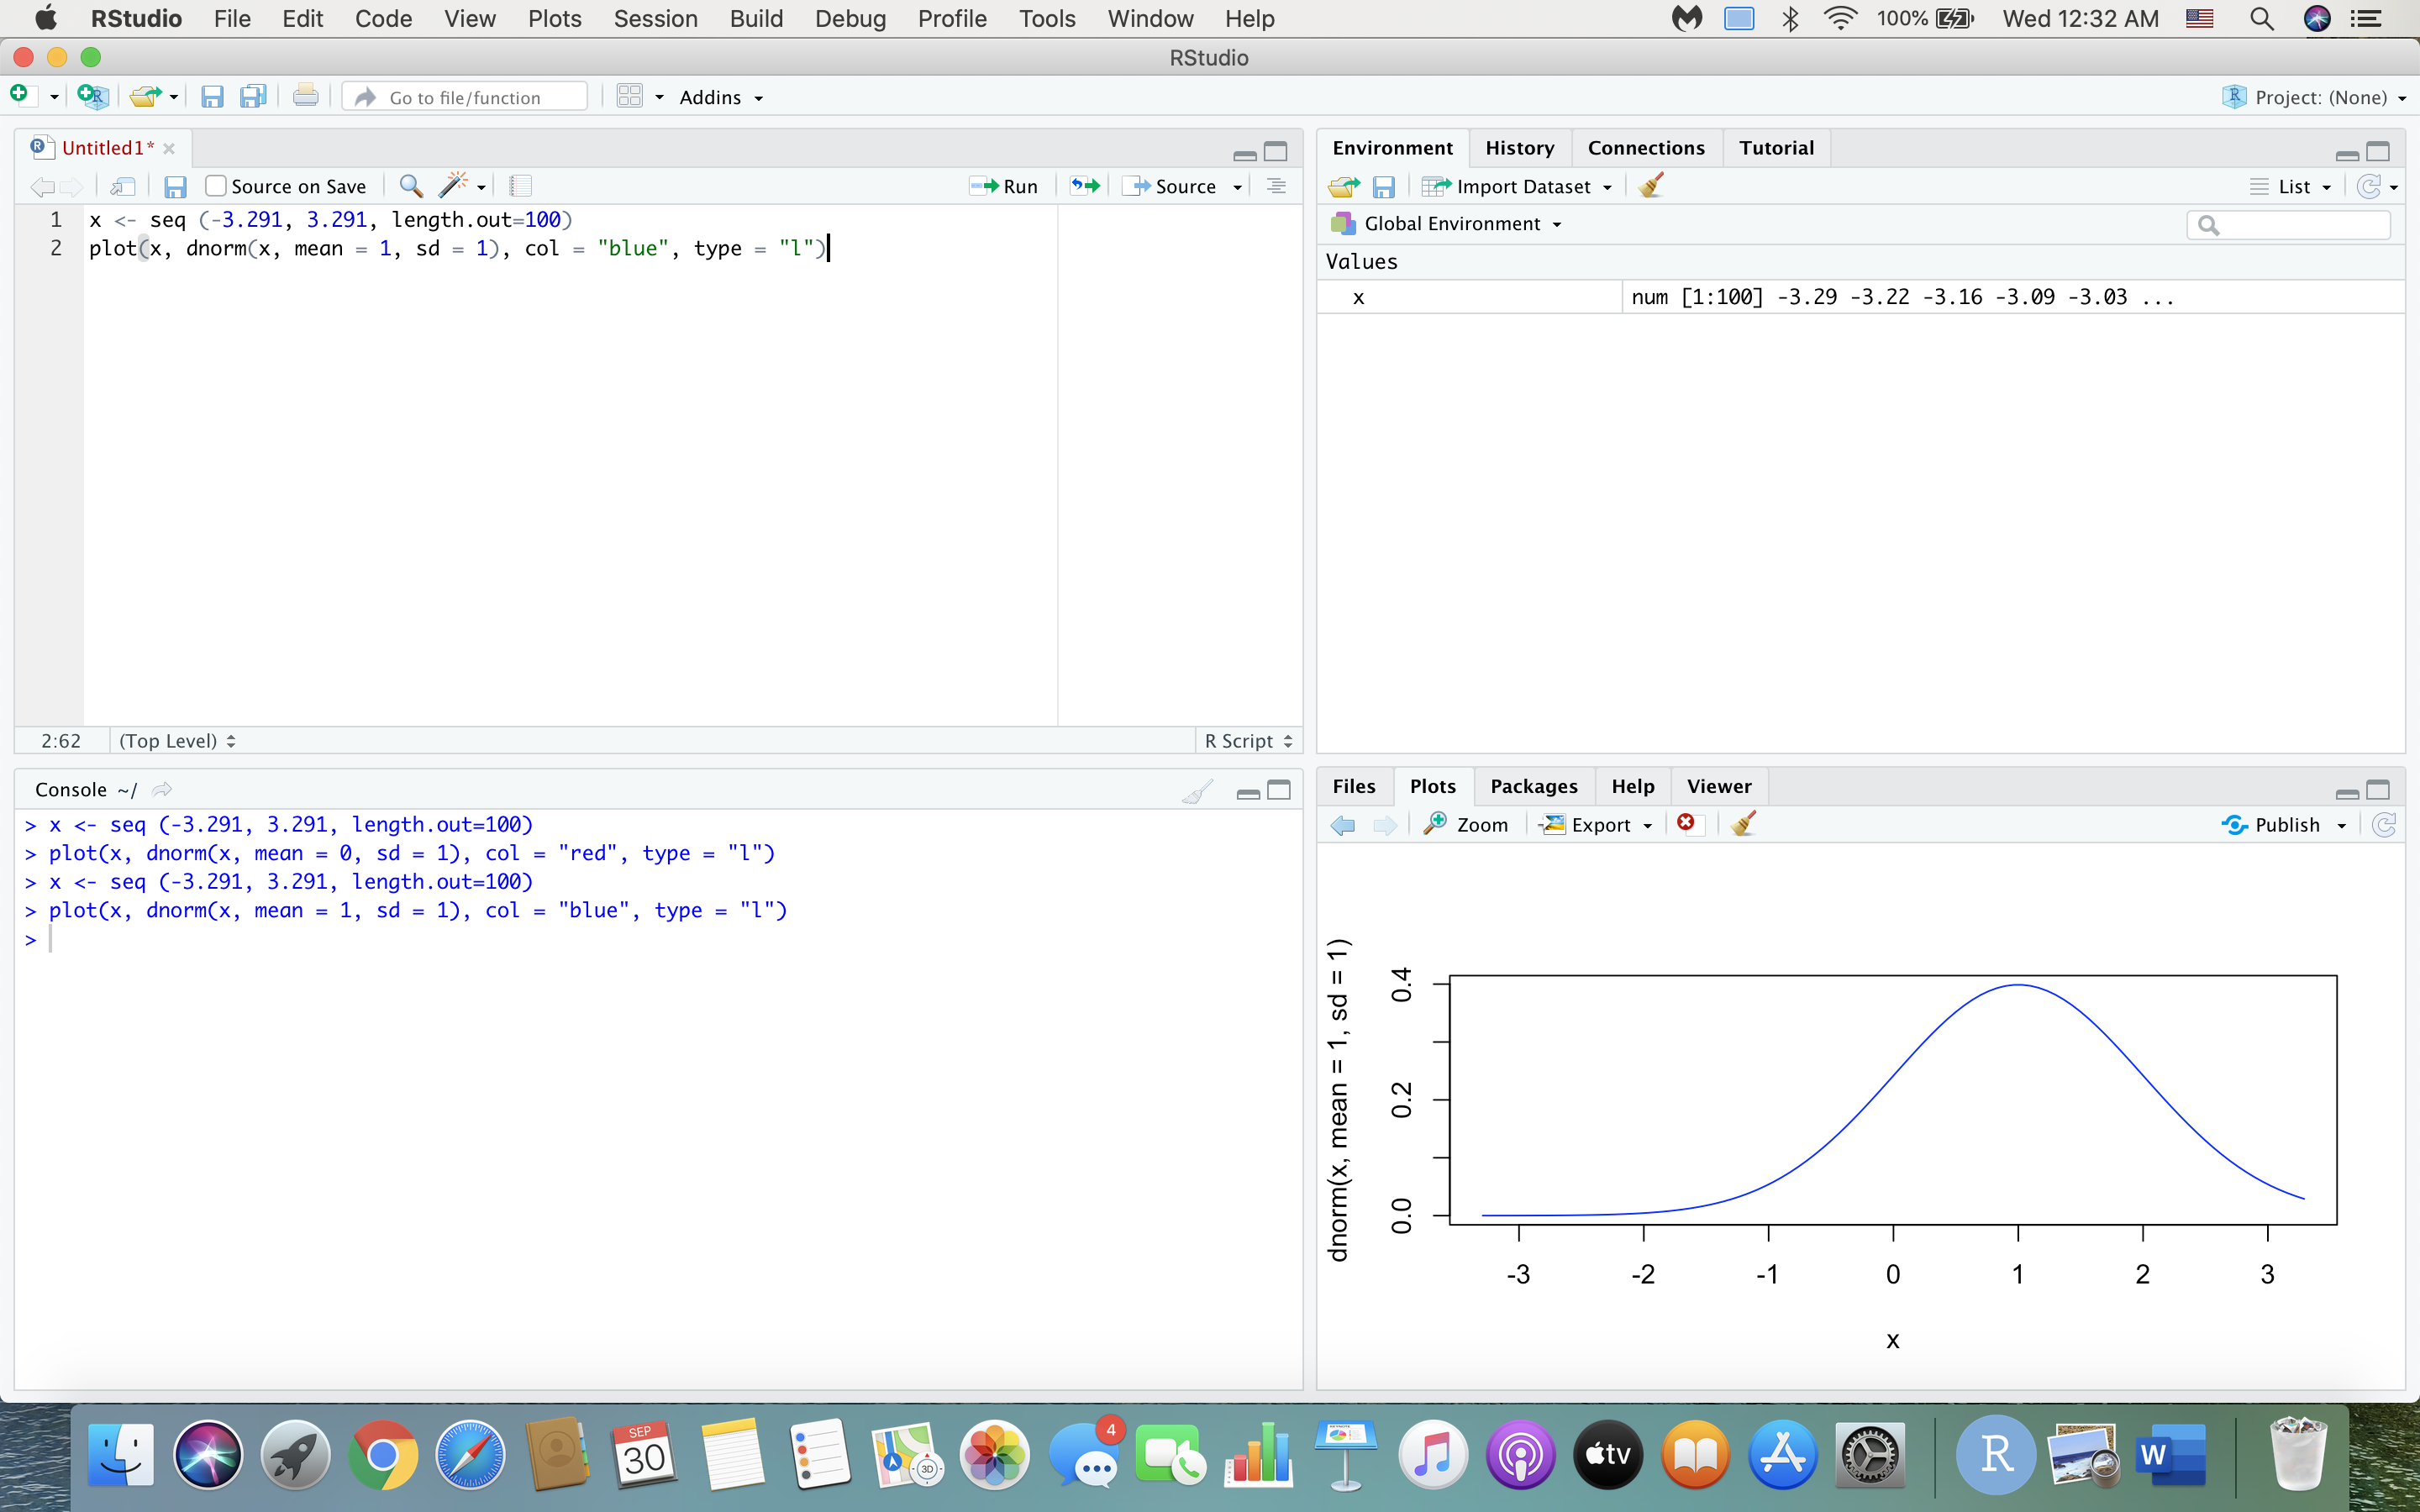
- At this point we should have a standard normal curve. Now we'll see what happens when we change the parameters. First, let's change the mean from 0 to 1: lines(x, dnorm(x, mean = 1, sd = 1), col = "blue") "lines" will plot lines, but without erasing the previous plot. In other words, it'll plot the lines on the same graph as before. We changed the color to blue so you can see which plot is which.
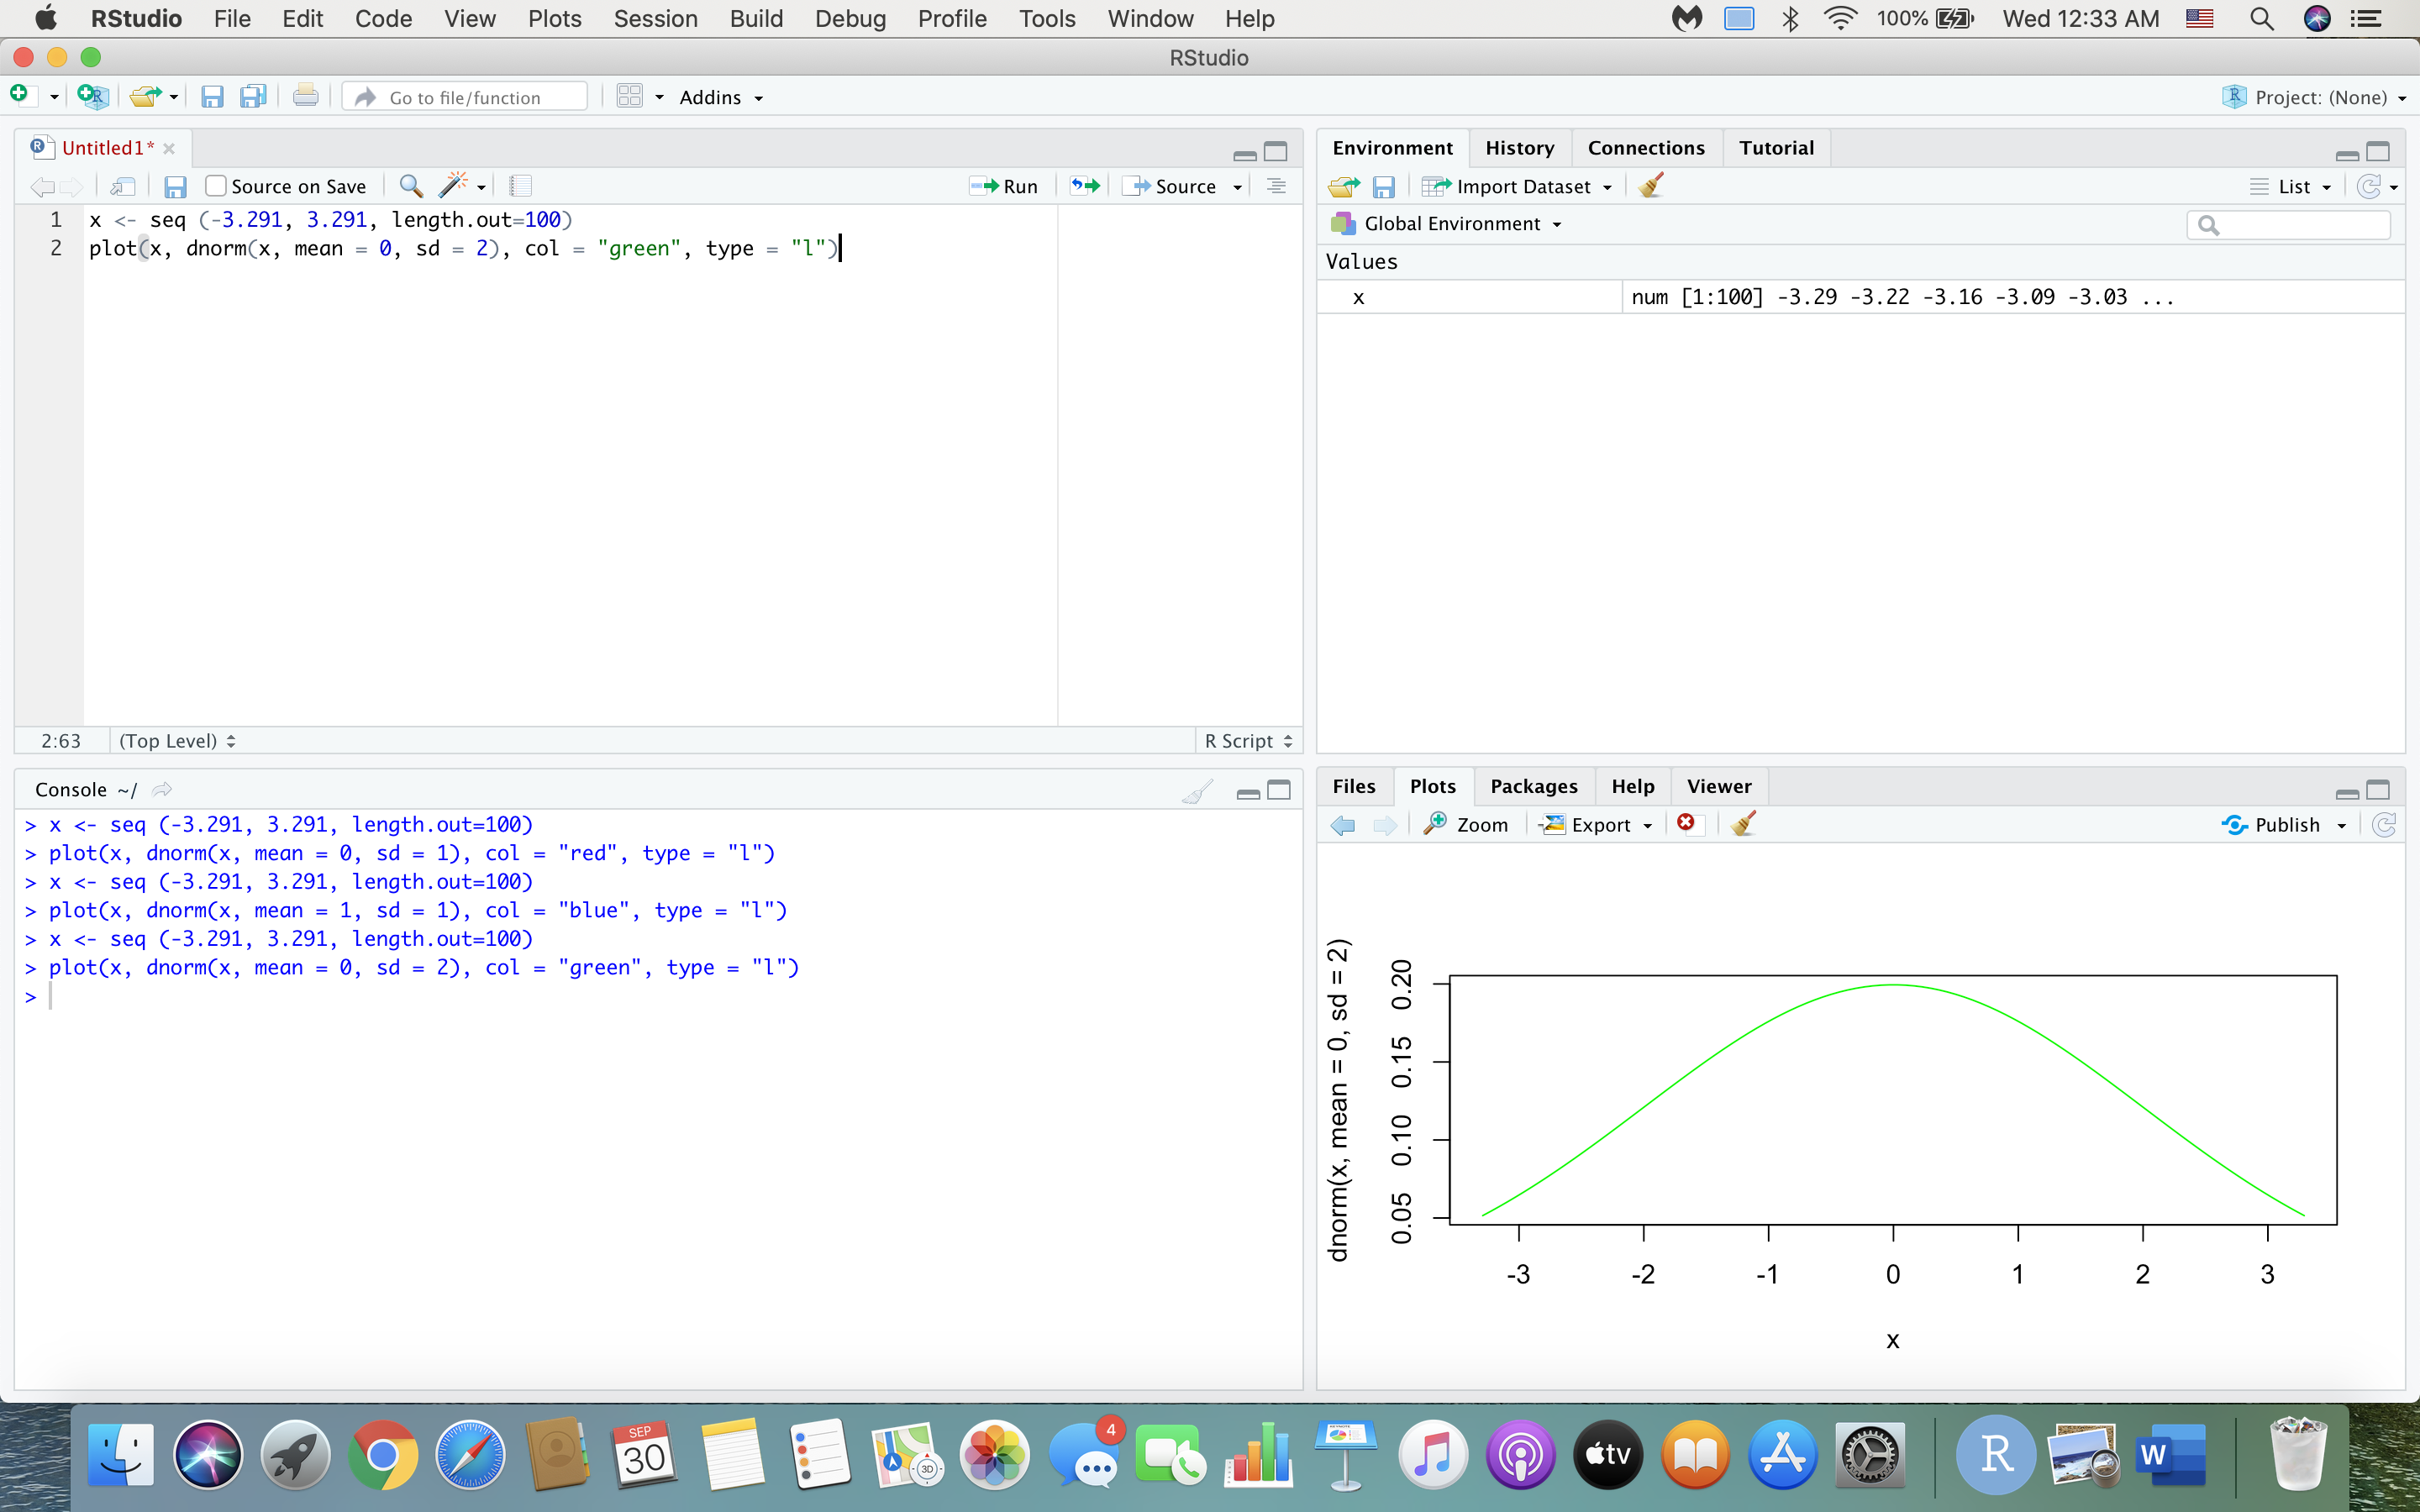
(a) What happened to the normal distribution? How is it different from the first distribution you plotted? Now let's adjust the standard deviation: lines(x, dnorm(x, mean = 0, sd = 2), col = "green")
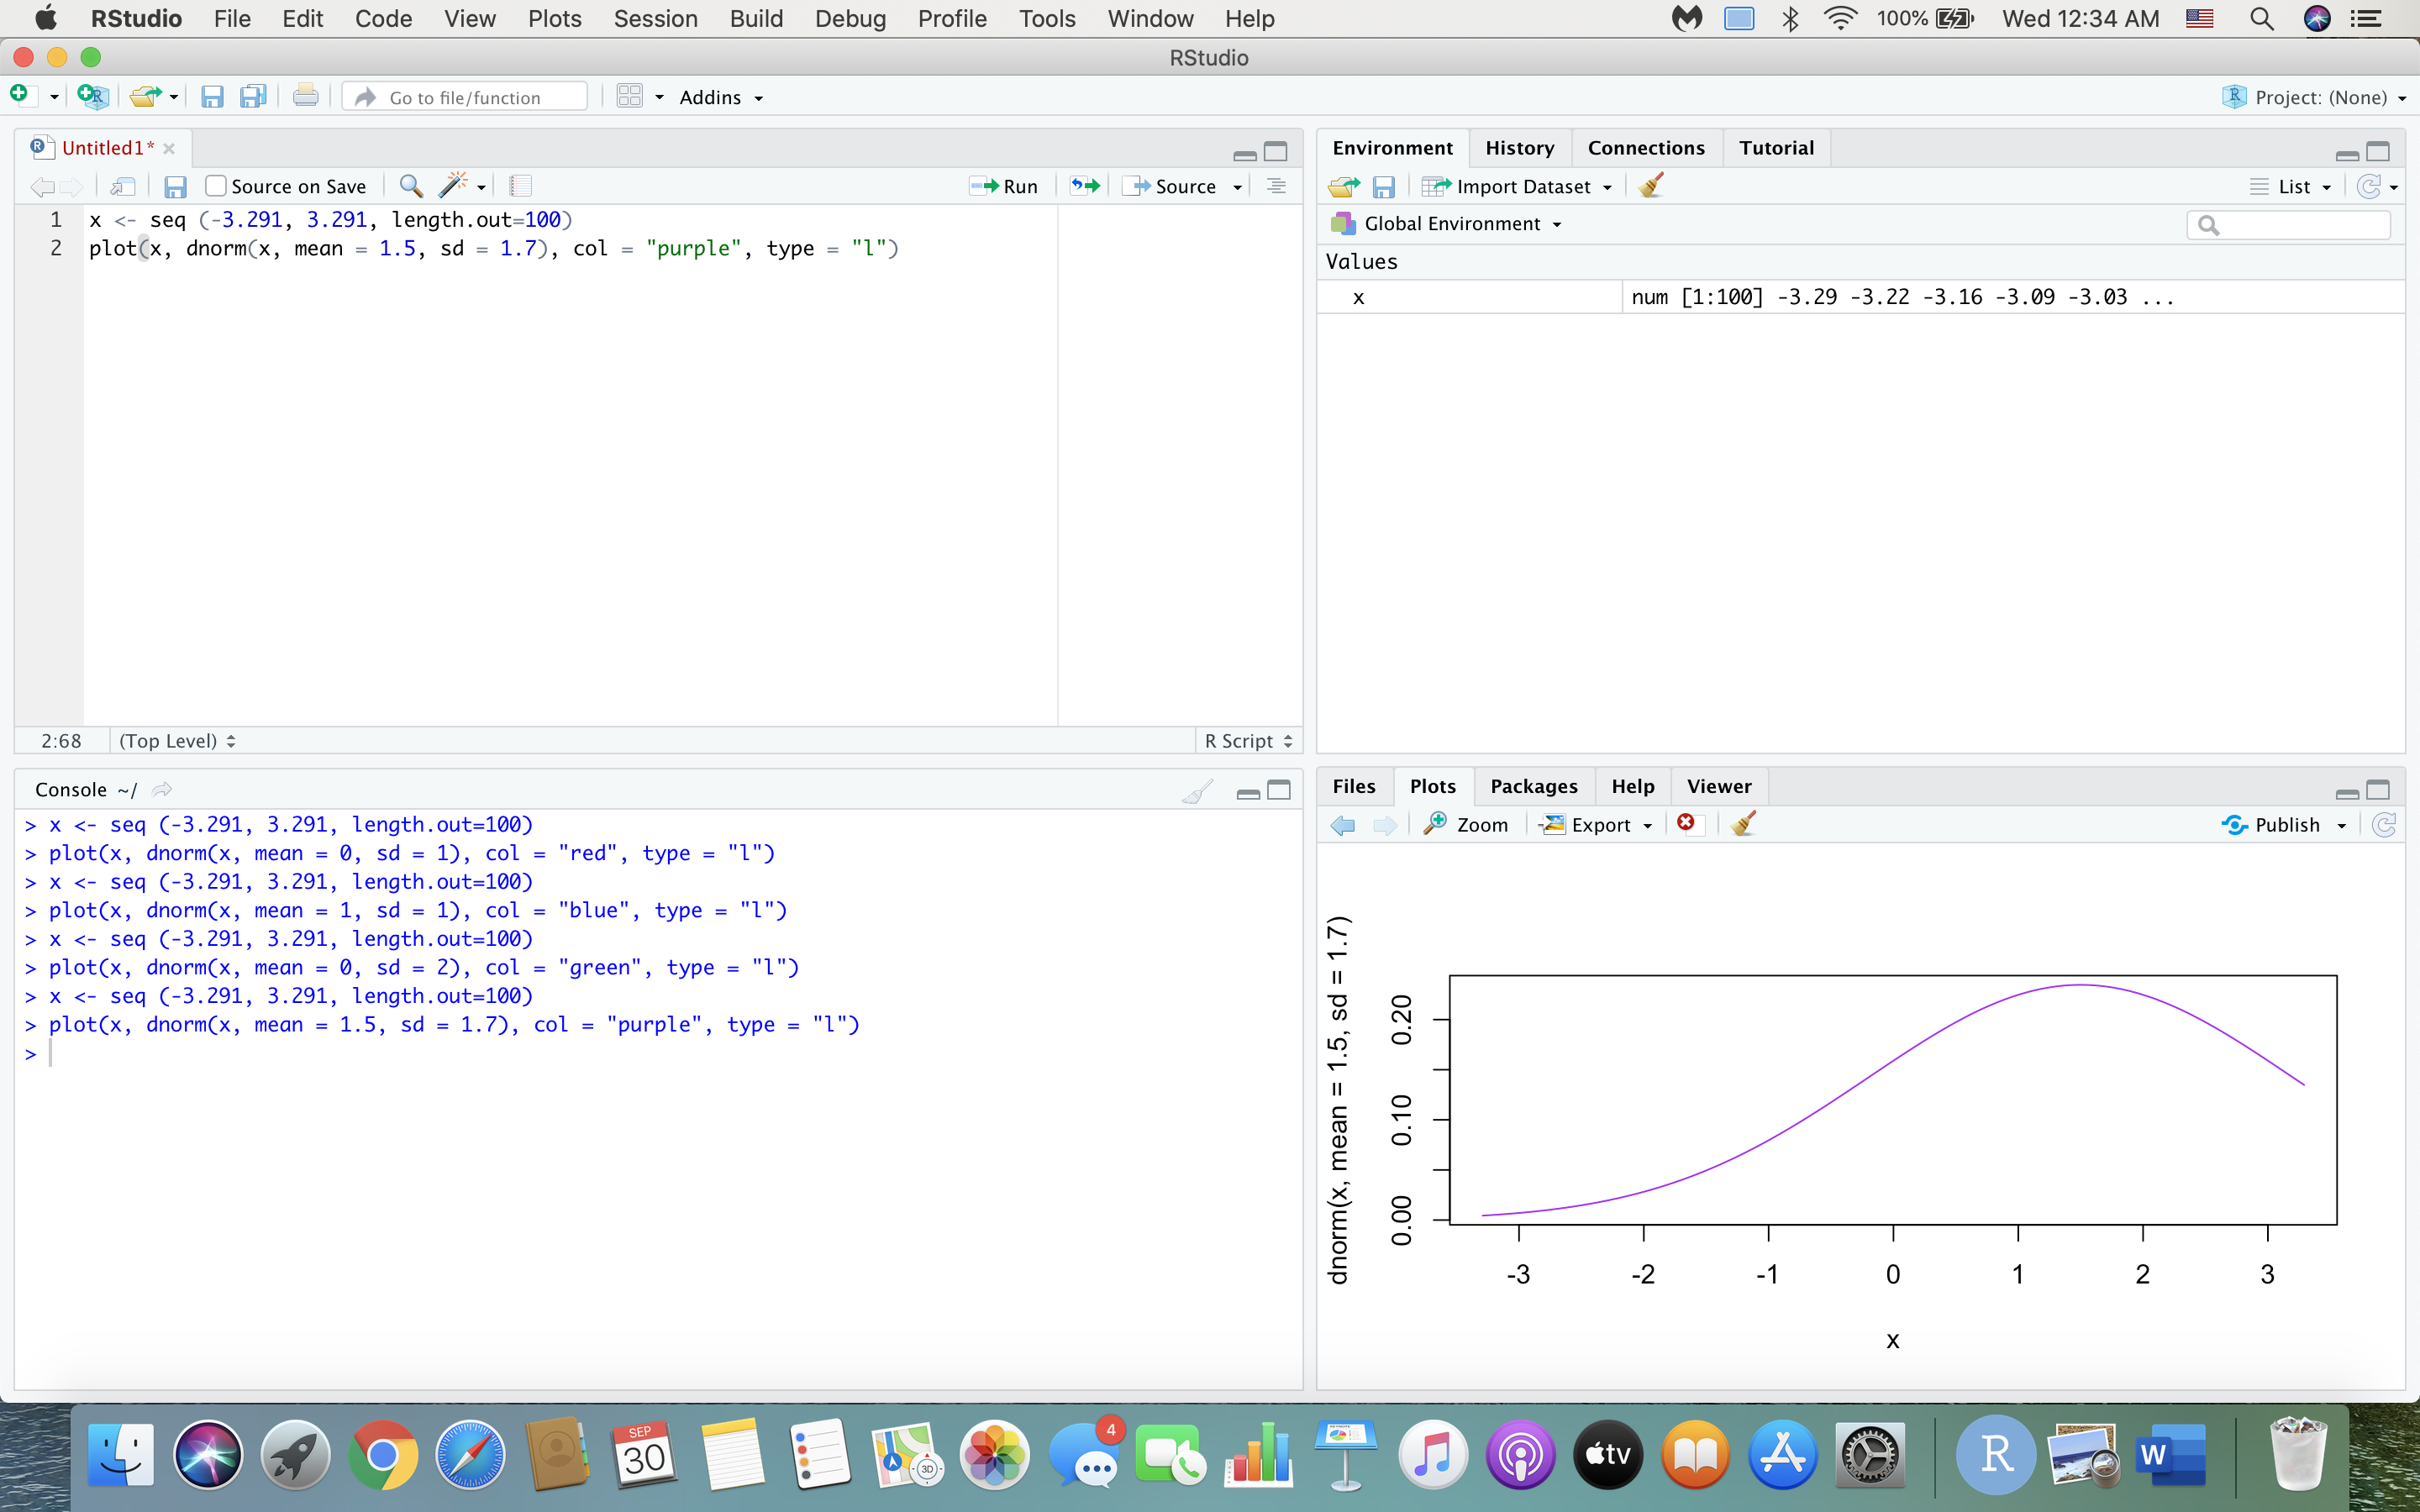
(b) Again, what happened to the normal distribution? How is it different from the previous normal distributions we plotted? Finally, let's adjust both the mean and standard deviation. lines(x, dnorm(x, mean = 1.5, sd = 1.7), col = "purple")
(c) How is this different from the above normal distributions? At this point the graph should have four curves plotted on top of each other in your final graph.
(d) Can you understand now how important the parameters of a distribution are? What do the parameters of a distribution tell us about the distribution?
FOR (c)
RStudio File Edit Code View Plots Session Build Debug Profile Tools Window Help M O X 100% 27 Wed 12:32 AM Q DE RStudio + - PR -| | Go to file/ function 1 8 . Addins . R Project: (None) Untitled 1* x Environment History Connections Tutorial Source on Save Run Source - | Import Dataset List . G . 1 x x plot(x, dnorm(x, mean = 0, sd = 1), col = "red", type = "1") dnorm(x, mean = 0, sd = 1) 0.4 0.2 0.0 -3 -2 -1 O 1 2 3 X SEP 30 A R WRStudio File Edit Code View Plots Session Build Debug Profile Tools Window Help M O X 100% 27 Wed 12:32 AM Q DE RStudio + - PR -| | Go to file/ function 1 8 . Addins . R Project: (None) Untitled 1* x Environment History Connections Tutorial Source on Save Run - Source - | Import Dataset List . G . 1 x | Global Environment . Q Values X num [1:100] -3.29 -3.22 -3. 16 -3.09 -3.03 ... 2:62 (Top Level) R Script Console ~/ Files Plots Packages Help Viewer > x plot(x, dnorm(x, mean = 1, sd = 1), col = "blue", type = "1") dnorm(x, mean = 1, sd = 1) 0.4 0.2 0.0 -3 -2 -1 O 1 2 3 X SEP 30 A R WRStudio File Edit Code View Plots Session Build Debug Profile Tools Window Help M O X 100% 27 Wed 12:33 AM Q DE RStudio + - PR -| | Go to file/ function 1 8 . Addins . R Project: (None) Untitled 1* x Environment History Connections Tutorial Source on Save Run - Source - | Import Dataset List . G . 1 x | Global Environment . Q Values X num [1:100] -3.29 -3.22 -3. 16 -3.09 -3.03 ... 2:63 (Top Level) R Script Console ~|~ Files Plots Packages Help Viewer > x plot(x, dnorm(x, mean = 0, sd = 2), col = "green", type = "1") dnorm(x, mean = 0, sd = 2) 0.05 0.10 0.15 0.20 -3 -2 -1 O 1 N 3 X SEP 30 citv A R WRStudio File Edit Code View Plots Session Build Debug Profile Tools Window Help M O X 100% 27 Wed 12:34 AM Q DE RStudio + - PR -| | Go to file/ function 1 8 . Addins . R Project: (None) Untitled 1* x Environment History Connections Tutorial Source on Save Run - Source . | Import Dataset List . G . 1 x x plot(x, dnorm(x, mean = 0, sd = 2), col = "green", type = "1") x plot(x, dnorm(x, mean = 1.5, sd = 1.7), col = "purple", type = "1") dnorm(x, mean = 1.5, sd = 1.7) 0.20 0.10 0.00 -3 -2 -1 O 1 N 3 X SEP 30 citv A R WRStudio File Edit Code View Plots Session Build Debug Profile Tools Window Help M 100% 27 Wed 2:36 AM Q DE RStudio + - PR -| | Go to file/ function 1 89 . Addins . R Project: (None) Untitled1* x Environment History Connections Tutorial Source on Save Run - Source . | Import Dataset x x lines(x, dnorm(x, mean = 0, sd = 2), col = "green") > lines(x, dnorm(x, mean = 1.5, sd = 1.7), col = "purple") dnorm(x, mean = 0, sd = 1) 0.4 0.2 0.0 -3 -2 -1 O 1 N 3 X SEP 30 A R W
Step by Step Solution
There are 3 Steps involved in it

Get step-by-step solutions from verified subject matter experts