

Question: Flinder Valves Case Study 2) Report your opening offer in dollars per share. (10% of points, full points awarded for putting a valid number) 3)
Flinder Valves Case Study
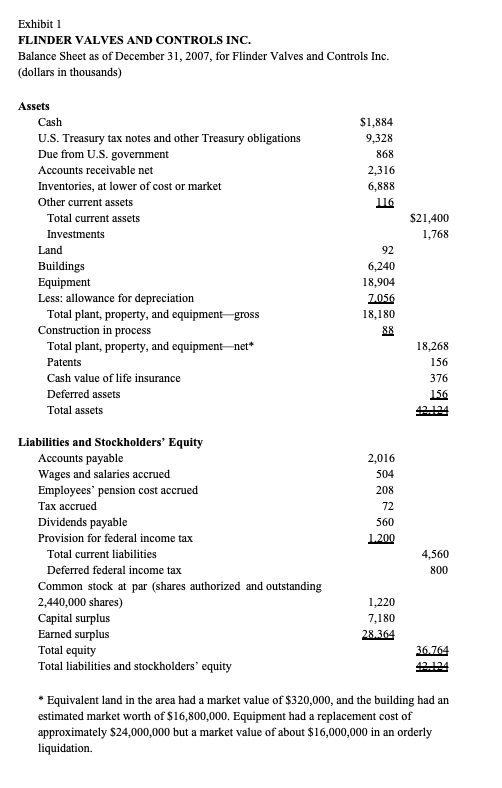
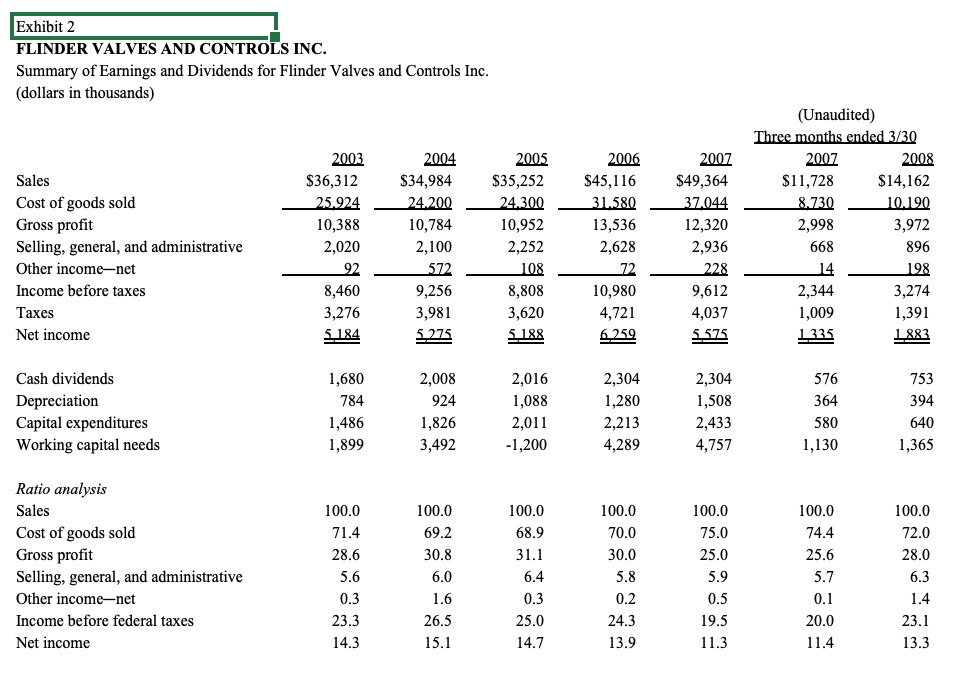
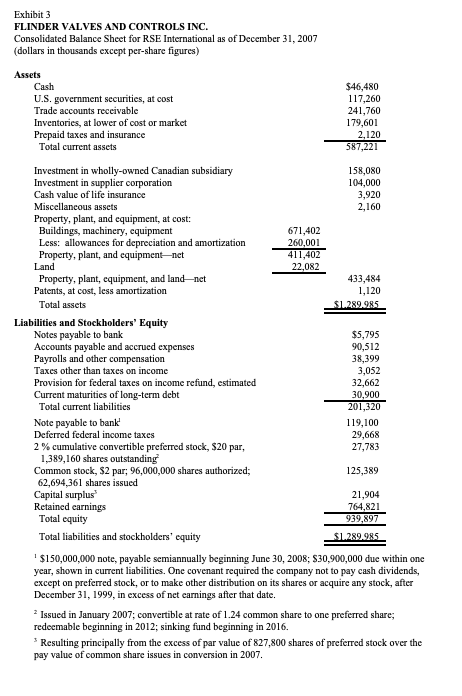
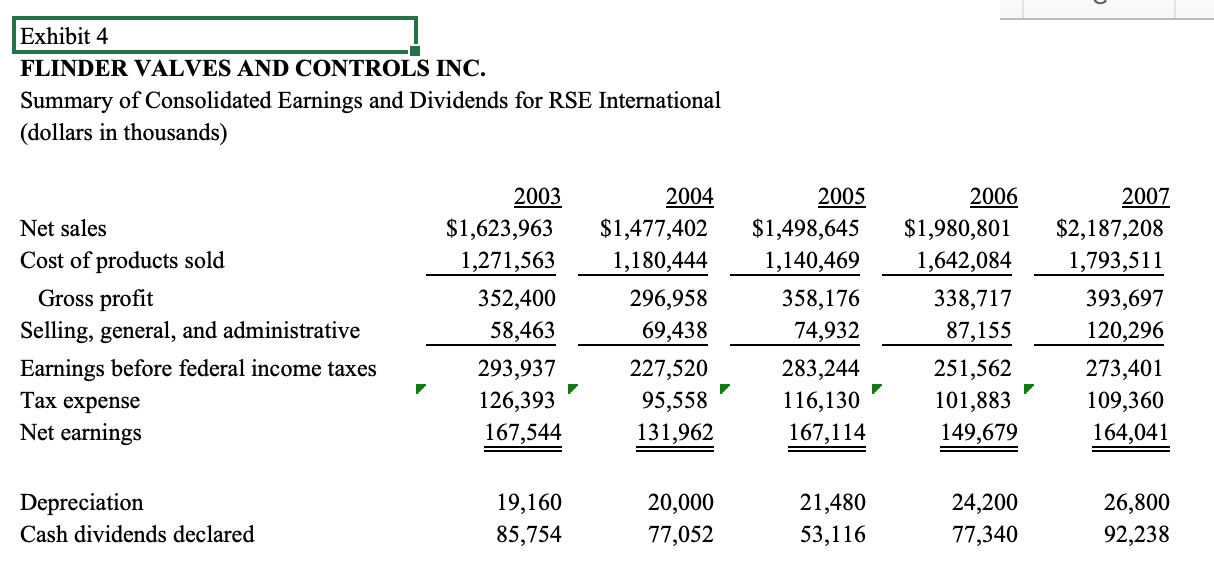
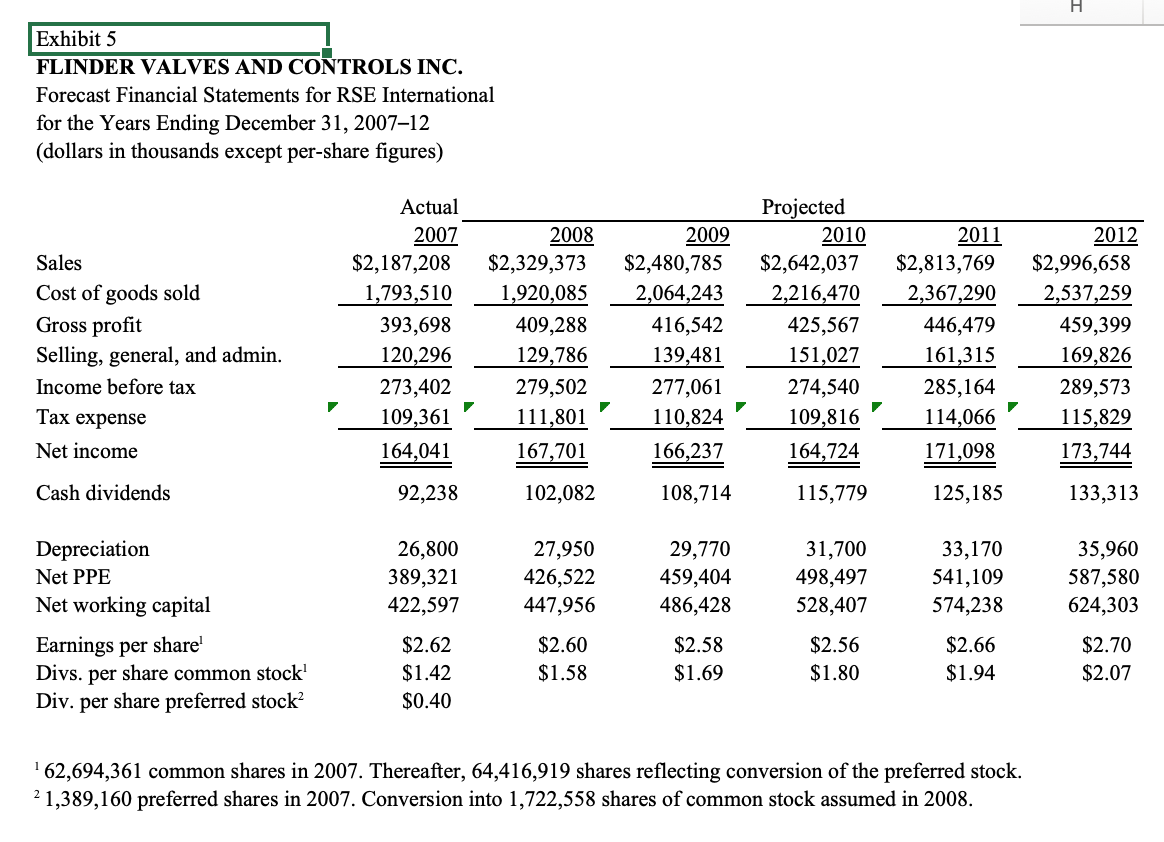
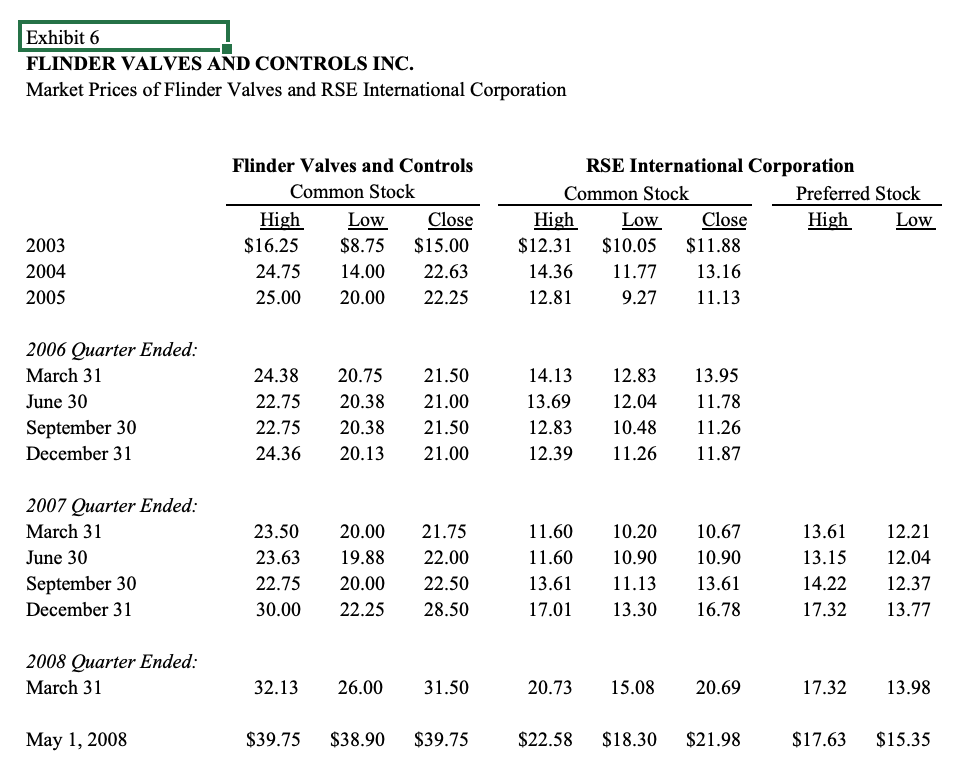
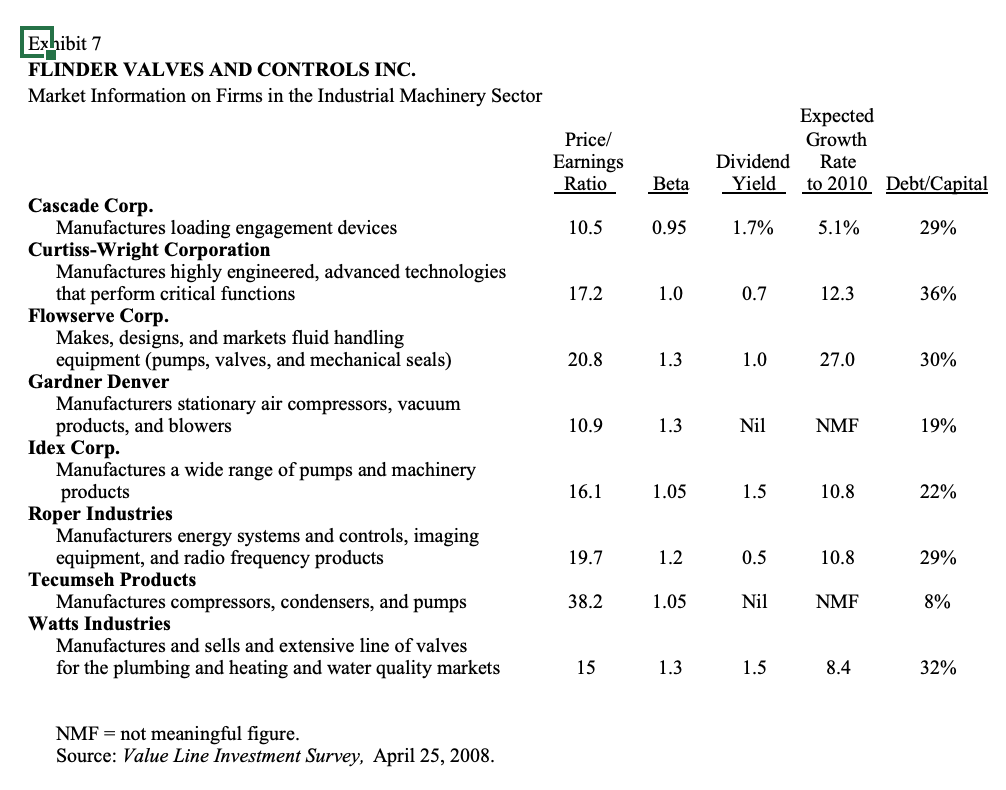
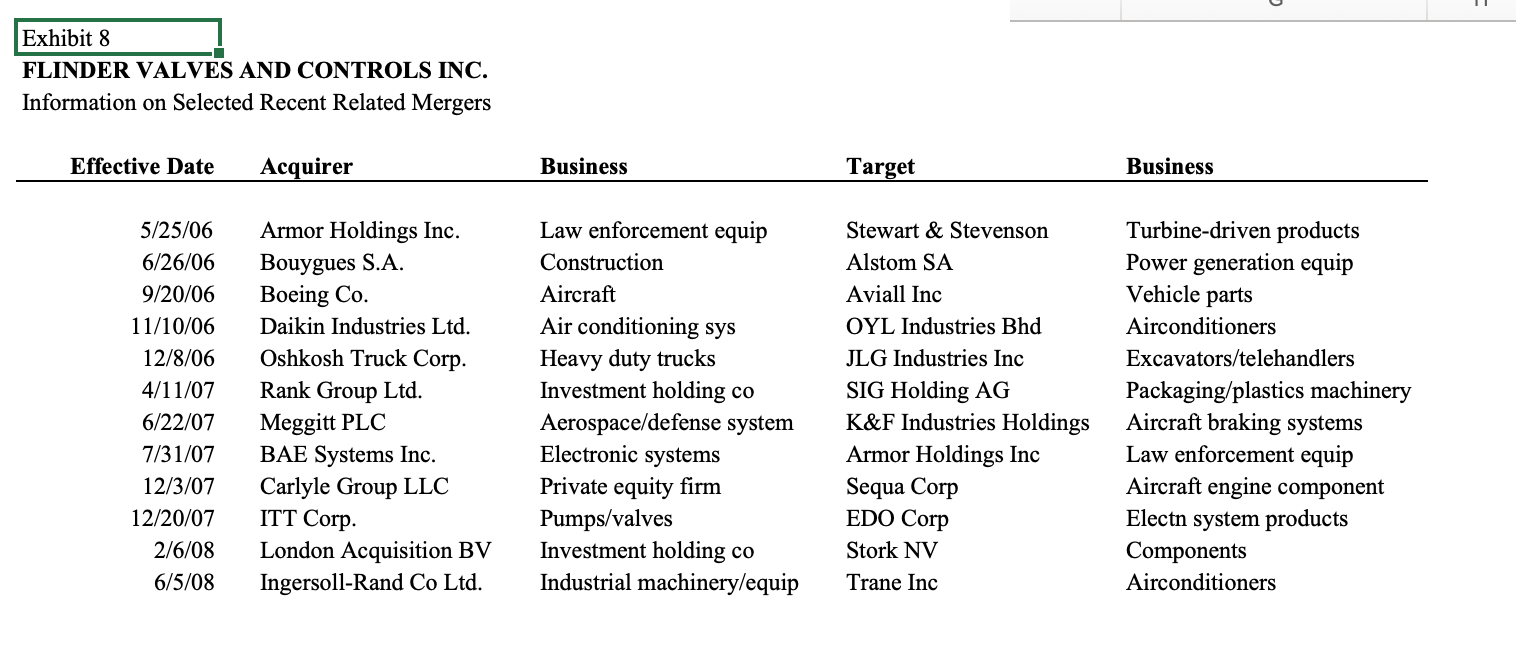
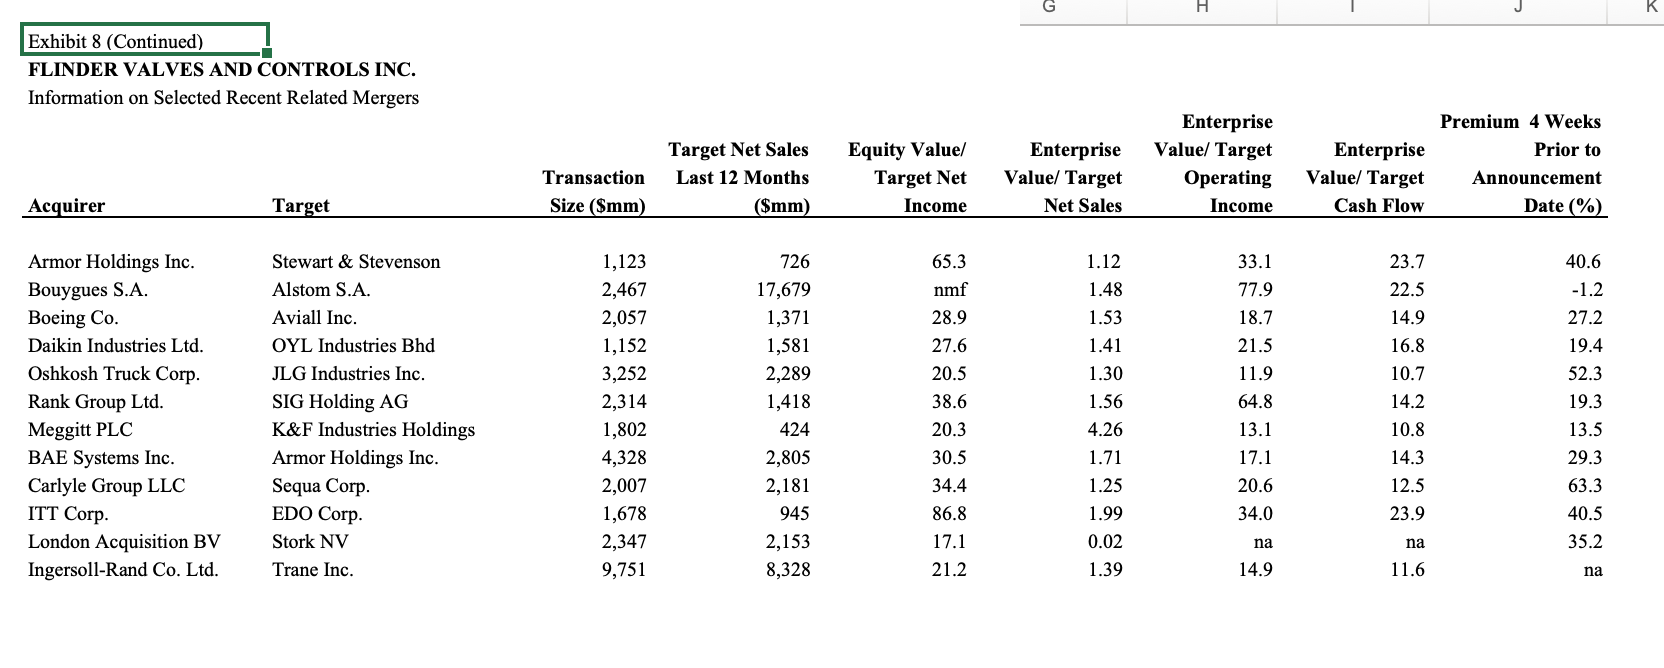
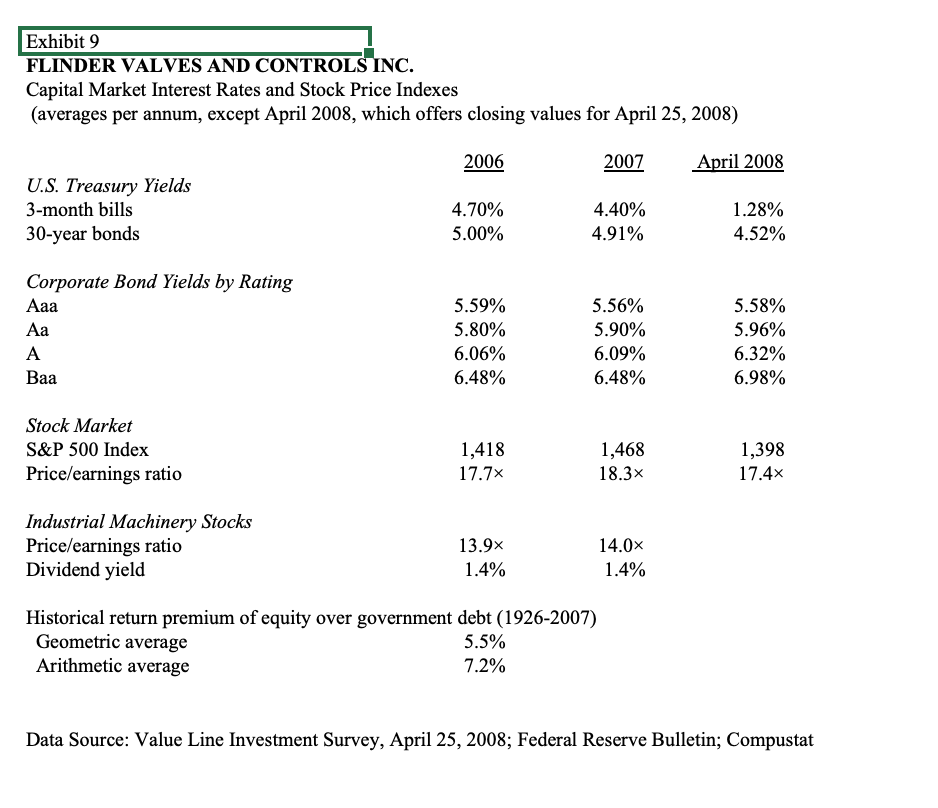
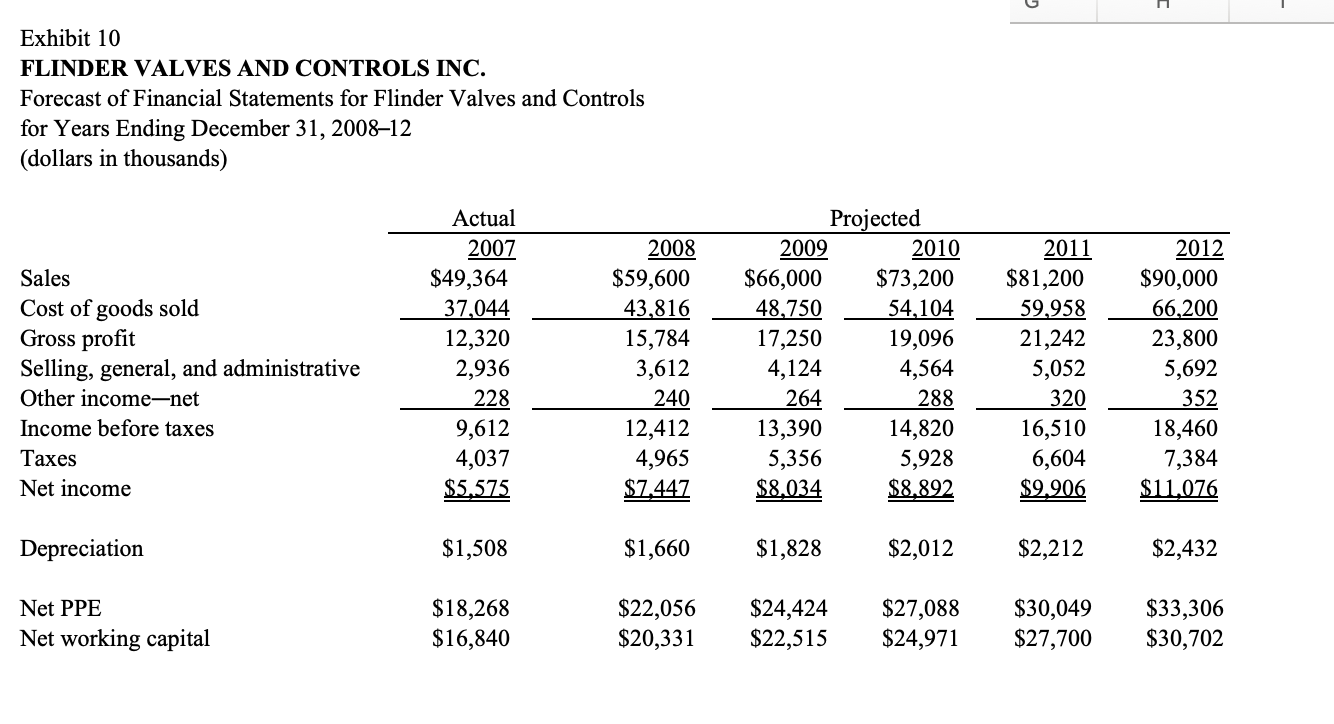
2) Report your opening offer in dollars per share. (10% of points, full points awarded for putting a valid number) 3) Report your walk-away price in dollars per share. This is the price beyond which you will abandon the negotiations. (10% of points, full points awarded for putting a valid number) 4) Put your answers for #1 and #2 into the Qualtrics survey (10% of points) 5) List your three most important negotiation objectives (non-monetary goals). Hint: a good goal must be a) measurable, b) achievable, and c) provide a tangible benefit. (20% of points) 6) Justify your walk-away price. Show the full calculations that you used to arrive this number. This should include a complete valuation analysis of the decision at hand, including various scenarios and sensitivity tests (40% of points). Exhibit 1 FLINDER VALVES AND CONTROLS INC. Balance Sheet as of December 31, 2007, for Flinder Valves and Controls Inc. (dollars in thousands) $1,884 9,328 868 2,316 6,888 116 $21,400 1,768 Assets Cash U.S. Treasury tax notes and other Treasury obligations Due from U.S. government Accounts receivable net Inventories, at lower of cost or market Other current assets Total current assets Investments Land Buildings Equipment Less: allowance for depreciation Total plant, property, and equipment gross Construction in process Total plant, property, and equipment-net* Patents Cash value of life insurance Deferred assets Total assets 92 6,240 18,904 7056 18,180 88 18,268 156 376 156 41 2,016 504 208 72 560 L200 Liabilities and Stockholders' Equity Accounts payable Wages and salaries accrued Employees' pension cost accrued Tax accrued Dividends payable Provision for federal income tax Total current liabilities Deferred federal income tax Common stock at par (shares authorized and outstanding 2,440,000 shares) Capital surplus Earned surplus Total equity Total liabilities and stockholders' equity 4,560 800 1,220 7,180 28.364 36.764 1.1.24 Equivalent land in the area had a market value of $320,000, and the building had an estimated market worth of $16,800,000. Equipment had a replacement cost of approximately $24,000,000 but a market value of about $16,000,000 in an orderly liquidation Exhibit 2 FLINDER VALVES AND CONTROLS INC. Summary of Earnings and Dividends for Flinder Valves and Controls Inc. (dollars in thousands) Sales Cost of goods sold Gross profit Selling, general, and administrative Other income-net Income before taxes Taxes Net income 2003 $36,312 25.924 10,388 2,020 92 8,460 3,276 5184 2004 $34,984 24.200 10,784 2,100 572 9,256 3,981 5275 2005 $35,252 24.300 10,952 2,252 108 8,808 3,620 5188 2006 $45,116 31.580 13,536 2,628 72 10,980 4,721 6259 2007 $49,364 37.044 12,320 2,936 228 9,612 4,037 5575 (Unaudited) Three months ended 3/30 2007 2008 $11,728 $14,162 8.730 10.190 2,998 3,972 668 896 14 198 2,344 3,274 1,009 1 335 1883 1,391 2,016 1,088 Cash dividends Depreciation Capital expenditures Working capital needs 1,680 784 1,486 1,899 2,008 924 1,826 3,492 2,304 1,280 2,213 4,289 2,304 1,508 2,433 4,757 576 364 580 1,130 753 394 640 1,365 2,011 -1,200 Ratio analysis Sales Cost of goods sold Gross profit Selling, general, and administrative Other income-net Income before federal taxes Net income 100.0 71.4 28.6 5.6 0.3 23.3 14.3 100.0 69.2 30.8 6.0 1.6 26.5 15.1 100.0 68.9 31.1 6.4 100.0 70.0 30.0 5.8 0.2 24.3 13.9 100.0 75.0 25.0 5.9 0.5 19.5 11.3 100.0 74.4 25.6 5.7 0.1 20.0 11.4 100.0 72.0 28.0 6.3 1.4 0.3 25.0 23.1 14.7 13.3 Exhibit 3 FLINDER VALVES AND CONTROLS INC. Consolidated Balance Sheet for RSE International as of December 31, 2007 (dollars in thousands except per-share figures) Assets Cash U.S. government securities, at cost Trade accounts receivable Inventories, at lower of cost or market Prepaid taxes and insurance Total current assets $46,480 117,260 241,760 179,601 2,120 587,221 1.120 Investment in wholly-owned Canadian subsidiary 158,080 Investment in supplier corporation 104,000 Cash value of life insurance 3,920 Miscellaneous assets 2,160 Property, plant, and equipment, at cost: Buildings, machinery, equipment 671,402 Less: allowances for depreciation and amortization 260,001 Property, plant, and equipment-net 411,402 Land 22,082 Property, plant, equipment, and landnet 433,484 Patents, at cost, less amortization Total assets $1289.985 Liabilities and Stockholders' Equity Notes payable to bank $5,795 Accounts payable and accrued expenses 90,512 Payrolls and other compensation 38,399 Taxes other than taxes on income 3,052 Provision for federal taxes on income refund, estimated 32,662 Current maturities of long-term debt 30,900 Total current liabilities 201,320 Note payable to bank 119,100 Deferred federal income taxes 29,668 2% cumulative convertible preferred stock, $20 par, 27,783 1,389,160 shares outstanding Common stock, $2 par; 96,000,000 shares authorized; 125,389 62,694,361 shares issued Capital surplus 21,904 Retained earnings 764,821 Total equity 939,897 Total liabilities and stockholders' equity $1.289.985 $150,000,000 note, payable semiannually beginning June 30, 2008; $30,900,000 due within one year, shown in current liabilities. One covenant required the company not to pay cash dividends, except on preferred stock, or to make other distribution on its shares or acquire any stock, after December 31, 1999, in excess of net earnings after that date. 2 Issued in January 2007; convertible at rate of 1.24 common share to one preferred share; redeemable beginning in 2012; sinking fund beginning in 2016. Resulting principally from the excess of par value of 827,800 shares of preferred stock over the pay value of common share issues in conversion in 2007. Exhibit 4 FLINDER VALVES AND CONTROLS INC. Summary of Consolidated Earnings and Dividends for RSE International (dollars in thousands) Net sales Cost of products sold Gross profit Selling, general, and administrative Earnings before federal income taxes Tax expense Net earnings 2003 $1,623,963 1,271,563 352,400 58,463 293,937 126,393 167,544 2004 $1,477,402 1,180,444 296,958 69,438 227,520 95,558 131,962 2005 $1,498,645 1,140,469 358,176 74,932 283,244 116,130 167,114 2006 $1,980,801 1,642,084 338,717 87,155 251,562 101,883 149,679 2007 $2,187,208 1,793,511 393,697 120,296 273,401 109,360 164,041 Depreciation Cash dividends declared 19,160 85,754 20,000 77,052 21,480 53,116 24,200 77,340 26,800 92,238 H Exhibit 5 FLINDER VALVES AND CONTROLS INC. Forecast Financial Statements for RSE International for the Years Ending December 31, 2007-12 (dollars in thousands except per-share figures) Sales Cost of goods sold Gross profit Selling, general, and admin. Income before tax Tax expense Net income Actual 2007 $2,187,208 1,793,510 393,698 120,296 273,402 109,361 164,041 2008 $2,329,373 1,920,085 409,288 129,786 279,502 111,801 167,701 2009 $2,480,785 2,064,243 416,542 139,481 277,061 110,824 166,237 Projected 2010 $2,642,037 2,216,470 425,567 151,027 274,540 109,816 164,724 2011 $2,813,769 2,367,290 446,479 161,315 285,164 114,066 171,098 2012 $2,996,658 2,537,259 459,399 169,826 289,573 115,829 173,744 Cash dividends 92,238 102,082 108,714 115,779 125,185 133,313 26,800 389,321 422,597 27,950 426,522 447,956 29,770 459,404 486,428 $2.58 $1.69 31,700 498,497 528,407 33,170 541,109 574,238 Depreciation Net PPE Net working capital Earnings per share Divs. per share common stock Div. per share preferred stock? 35,960 587,580 624,303 $2.62 $1.42 $0.40 $2.60 $1.58 $2.56 $1.80 $2.66 $1.94 $2.70 $2.07 162,694,361 common shares in 2007. Thereafter, 64,416,919 shares reflecting conversion of the preferred stock. 2 1,389,160 preferred shares in 2007. Conversion into 1,722,558 shares of common stock assumed in 2008. Exhibit 6 FLINDER VALVES AND CONTROLS INC. Market Prices of Flinder Valves and RSE International Corporation Flinder Valves and Controls Common Stock High Low Close $16.25 $8.75 $15.00 24.75 14.00 22.63 25.00 20.00 22.25 RSE International Corporation Common Stock Preferred Stock High Low Close High Low $12.31 $10.05 $11.88 14.36 11.77 13.16 12.81 9.27 11.13 2003 2004 2005 20.75 2006 Quarter Ended: March 31 June 30 September 30 December 31 20.38 24.38 22.75 22.75 24.36 21.50 21.00 21.50 14.13 13.69 12.83 12.39 12.83 12.04 10.48 11.26 13.95 11.78 11.26 11.87 20.38 20.13 21.00 20.00 2007 Quarter Ended: March 31 June 30 September 30 December 31 19.88 23.50 23.63 22.75 30.00 21.75 22.00 22.50 28.50 11.60 11.60 13.61 17.01 10.20 10.90 11.13 13.30 10.67 10.90 13.61 16.78 13.61 13.15 14.22 17.32 12.21 12.04 12.37 13.77 20.00 22.25 2008 Quarter Ended: March 31 32.13 26.00 31.50 20.73 15.08 20.69 17.32 13.98 May 1, 2008 $39.75 $38.90 $39.75 $22.58 $18.30 $21.98 $17.63 $15.35 Exhibit 7 FLINDER VALVES AND CONTROLS INC. Market Information on Firms in the Industrial Machinery Sector Price/ Earnings Expected Growth Dividend Rate Yield to 2010 Debt/Capital Ratio Beta 10.5 0.95 1.7% 5.1% 29% 17.2 1.0 0.7 12.3 36% 20.8 1.3 1.0 27.0 30% 10.9 1.3 Nil NMF 19% Cascade Corp. Manufactures loading engagement devices Curtiss-Wright Corporation Manufactures highly engineered, advanced technologies that perform critical functions Flowserve Corp. Makes, designs, and markets fluid handling equipment (pumps, valves, and mechanical seals) Gardner Denver Manufacturers stationary air compressors, vacuum products, and blowers Idex Corp. Manufactures a wide range of pumps and machinery products Roper Industries Manufacturers energy systems and controls, imaging equipment, and radio frequency products Tecumseh Products Manufactures compressors, condensers, and pumps Watts Industries Manufactures and sells and extensive line of valves for the plumbing and heating and water quality markets 16.1 1.05 1.5 10.8 22% 19.7 1.2 0.5 10.8 29% 38.2 1.05 Nil NMF 8% 15 1.3 1.5 8.4 32% NMF = not meaningful figure. Source: Value Line Investment Survey, April 25, 2008. Exhibit 8 FLINDER VALVES AND CONTROLS INC. Information on Selected Recent Related Mergers Effective Date Acquirer Business Target Business 5/25/06 6/26/06 9/20/06 11/10/06 12/8/06 4/11/07 6/22/07 7/31/07 12/3/07 12/20/07 2/6/08 6/5/08 Armor Holdings Inc. Bouygues S.A. Boeing Co. Daikin Industries Ltd. Oshkosh Truck Corp. Rank Group Ltd. Meggitt PLC BAE Systems Inc. Carlyle Group LLC ITT Corp. London Acquisition BV Ingersoll-Rand Co Ltd. Law enforcement equip Construction Aircraft Air conditioning sys Heavy duty trucks Investment holding co Aerospace/defense system Electronic systems Private equity firm Pumps/valves Investment holding co Industrial machinery/equip Stewart & Stevenson Alstom SA Aviall Inc OYL Industries Bhd JLG Industries Inc SIG Holding AG K&F Industries Holdings Armor Holdings Inc Sequa Corp EDO Corp Stork NV Trane Inc Turbine-driven products Power generation equip Vehicle parts Airconditioners Excavators/telehandlers Packaging/plastics machinery Aircraft braking systems Law enforcement equip Aircraft engine component Electn system products Components Airconditioners H Exhibit 8 (Continued) FLINDER VALVES AND CONTROLS INC. Information on Selected Recent Related Mergers Target Net Sales Last 12 Months ($mm) Equity Value/ Target Net Income Transaction Size (mm) Enterprise Value/ Target Operating Income Enterprise Valuel Target Net Sales Premium 4 Weeks Prior to Announcement Date (%) Enterprise Value/ Target Cash Flow Acquirer Target 726 65.3 nmf 28.9 1.12 1.48 1.53 27.6 1.41 Armor Holdings Inc. Bouygues S.A. Boeing Co. Daikin Industries Ltd. Oshkosh Truck Corp. Rank Group Ltd. Meggitt PLC BAE Systems Inc. Carlyle Group LLC ITT Corp. London Acquisition BV Ingersoll-Rand Co. Ltd. Stewart & Stevenson Alstom S.A. Aviall Inc. OYL Industries Bhd JLG Industries Inc. SIG Holding AG K&F Industries Holdings Armor Holdings Inc. Sequa Corp. EDO Corp. Stork NV Trane Inc. 1,123 2,467 2,057 1,152 3,252 2,314 1,802 4,328 2,007 1,678 2,347 9,751 17,679 1,371 1,581 2,289 1,418 424 2,805 2,181 945 2,153 8,328 20.5 38.6 20.3 30.5 34.4 86.8 17.1 21.2 1.30 1.56 4.26 1.71 1.25 1.99 0.02 1.39 33.1 77.9 18.7 21.5 11.9 64.8 13.1 17.1 20.6 34.0 23.7 22.5 14.9 16.8 10.7 14.2 10.8 14.3 12.5 23.9 40.6 -1.2 27.2 19.4 52.3 19.3 13.5 29.3 63.3 40.5 35.2 na na 11.6 14.9 na Exhibit 9 FLINDER VALVES AND CONTROLS INC. Capital Market Interest Rates and Stock Price Indexes (averages per annum, except April 2008, which offers closing values for April 25, 2008) 2006 2007 April 2008 U.S. Treasury Yields 3-month bills 30-year bonds 4.70% 5.00% 4.40% 4.91% 1.28% 4.52% Corporate Bond Yields by Rating A Baa 5.59% 5.80% 6.06% 6.48% 5.56% 5.90% 6.09% 6.48% 5.58% 5.96% 6.32% 6.98% Stock Market S&P 500 Index Price/earnings ratio 1,418 17.7% 1,468 18.3x 1,398 17.4x Industrial Machinery Stocks Price/earnings ratio Dividend yield 13.9x 1.4% 14.0x 1.4% Historical return premium of equity over government debt (1926-2007) Geometric average 5.5% Arithmetic average 7.2% Data Source: Value Line Investment Survey, April 25, 2008; Federal Reserve Bulletin; Compustat Exhibit 10 FLINDER VALVES AND CONTROLS INC. Forecast of Financial Statements for Flinder Valves and Controls for Years Ending December 31, 200812 (dollars in thousands) Sales Cost of goods sold Gross profit Selling, general, and administrative Other income-net Income before taxes Taxes Net income Actual 2007 $49,364 37,044 12,320 2,936 228 9,612 4,037 $5.575 2008 $59,600 43,816 15,784 3,612 240 12,412 4,965 $7,447 Projected 2009 2010 $66,000 $73,200 48,750 54,104 17,250 19,096 4,124 4,564 264 288 13,390 14,820 5,356 5,928 $8.034 $8.892 2011 $81,200 59,958 21,242 5,052 320 16,510 6,604 $9.906 2012 $90,000 66,200 23,800 5,692 352 18,460 7,384 $11,076 Depreciation $1,508 $1,660 $1,828 $2,012 $2,212 $2,432 Net PPE Net working capital $18,268 $16,840 $22,056 $20,331 $24,424 $22,515 $27,088 $24,971 $30,049 $27,700 $33,306 $30,702 2) Report your opening offer in dollars per share. (10% of points, full points awarded for putting a valid number) 3) Report your walk-away price in dollars per share. This is the price beyond which you will abandon the negotiations. (10% of points, full points awarded for putting a valid number) 4) Put your answers for #1 and #2 into the Qualtrics survey (10% of points) 5) List your three most important negotiation objectives (non-monetary goals). Hint: a good goal must be a) measurable, b) achievable, and c) provide a tangible benefit. (20% of points) 6) Justify your walk-away price. Show the full calculations that you used to arrive this number. This should include a complete valuation analysis of the decision at hand, including various scenarios and sensitivity tests (40% of points). Exhibit 1 FLINDER VALVES AND CONTROLS INC. Balance Sheet as of December 31, 2007, for Flinder Valves and Controls Inc. (dollars in thousands) $1,884 9,328 868 2,316 6,888 116 $21,400 1,768 Assets Cash U.S. Treasury tax notes and other Treasury obligations Due from U.S. government Accounts receivable net Inventories, at lower of cost or market Other current assets Total current assets Investments Land Buildings Equipment Less: allowance for depreciation Total plant, property, and equipment gross Construction in process Total plant, property, and equipment-net* Patents Cash value of life insurance Deferred assets Total assets 92 6,240 18,904 7056 18,180 88 18,268 156 376 156 41 2,016 504 208 72 560 L200 Liabilities and Stockholders' Equity Accounts payable Wages and salaries accrued Employees' pension cost accrued Tax accrued Dividends payable Provision for federal income tax Total current liabilities Deferred federal income tax Common stock at par (shares authorized and outstanding 2,440,000 shares) Capital surplus Earned surplus Total equity Total liabilities and stockholders' equity 4,560 800 1,220 7,180 28.364 36.764 1.1.24 Equivalent land in the area had a market value of $320,000, and the building had an estimated market worth of $16,800,000. Equipment had a replacement cost of approximately $24,000,000 but a market value of about $16,000,000 in an orderly liquidation Exhibit 2 FLINDER VALVES AND CONTROLS INC. Summary of Earnings and Dividends for Flinder Valves and Controls Inc. (dollars in thousands) Sales Cost of goods sold Gross profit Selling, general, and administrative Other income-net Income before taxes Taxes Net income 2003 $36,312 25.924 10,388 2,020 92 8,460 3,276 5184 2004 $34,984 24.200 10,784 2,100 572 9,256 3,981 5275 2005 $35,252 24.300 10,952 2,252 108 8,808 3,620 5188 2006 $45,116 31.580 13,536 2,628 72 10,980 4,721 6259 2007 $49,364 37.044 12,320 2,936 228 9,612 4,037 5575 (Unaudited) Three months ended 3/30 2007 2008 $11,728 $14,162 8.730 10.190 2,998 3,972 668 896 14 198 2,344 3,274 1,009 1 335 1883 1,391 2,016 1,088 Cash dividends Depreciation Capital expenditures Working capital needs 1,680 784 1,486 1,899 2,008 924 1,826 3,492 2,304 1,280 2,213 4,289 2,304 1,508 2,433 4,757 576 364 580 1,130 753 394 640 1,365 2,011 -1,200 Ratio analysis Sales Cost of goods sold Gross profit Selling, general, and administrative Other income-net Income before federal taxes Net income 100.0 71.4 28.6 5.6 0.3 23.3 14.3 100.0 69.2 30.8 6.0 1.6 26.5 15.1 100.0 68.9 31.1 6.4 100.0 70.0 30.0 5.8 0.2 24.3 13.9 100.0 75.0 25.0 5.9 0.5 19.5 11.3 100.0 74.4 25.6 5.7 0.1 20.0 11.4 100.0 72.0 28.0 6.3 1.4 0.3 25.0 23.1 14.7 13.3 Exhibit 3 FLINDER VALVES AND CONTROLS INC. Consolidated Balance Sheet for RSE International as of December 31, 2007 (dollars in thousands except per-share figures) Assets Cash U.S. government securities, at cost Trade accounts receivable Inventories, at lower of cost or market Prepaid taxes and insurance Total current assets $46,480 117,260 241,760 179,601 2,120 587,221 1.120 Investment in wholly-owned Canadian subsidiary 158,080 Investment in supplier corporation 104,000 Cash value of life insurance 3,920 Miscellaneous assets 2,160 Property, plant, and equipment, at cost: Buildings, machinery, equipment 671,402 Less: allowances for depreciation and amortization 260,001 Property, plant, and equipment-net 411,402 Land 22,082 Property, plant, equipment, and landnet 433,484 Patents, at cost, less amortization Total assets $1289.985 Liabilities and Stockholders' Equity Notes payable to bank $5,795 Accounts payable and accrued expenses 90,512 Payrolls and other compensation 38,399 Taxes other than taxes on income 3,052 Provision for federal taxes on income refund, estimated 32,662 Current maturities of long-term debt 30,900 Total current liabilities 201,320 Note payable to bank 119,100 Deferred federal income taxes 29,668 2% cumulative convertible preferred stock, $20 par, 27,783 1,389,160 shares outstanding Common stock, $2 par; 96,000,000 shares authorized; 125,389 62,694,361 shares issued Capital surplus 21,904 Retained earnings 764,821 Total equity 939,897 Total liabilities and stockholders' equity $1.289.985 $150,000,000 note, payable semiannually beginning June 30, 2008; $30,900,000 due within one year, shown in current liabilities. One covenant required the company not to pay cash dividends, except on preferred stock, or to make other distribution on its shares or acquire any stock, after December 31, 1999, in excess of net earnings after that date. 2 Issued in January 2007; convertible at rate of 1.24 common share to one preferred share; redeemable beginning in 2012; sinking fund beginning in 2016. Resulting principally from the excess of par value of 827,800 shares of preferred stock over the pay value of common share issues in conversion in 2007. Exhibit 4 FLINDER VALVES AND CONTROLS INC. Summary of Consolidated Earnings and Dividends for RSE International (dollars in thousands) Net sales Cost of products sold Gross profit Selling, general, and administrative Earnings before federal income taxes Tax expense Net earnings 2003 $1,623,963 1,271,563 352,400 58,463 293,937 126,393 167,544 2004 $1,477,402 1,180,444 296,958 69,438 227,520 95,558 131,962 2005 $1,498,645 1,140,469 358,176 74,932 283,244 116,130 167,114 2006 $1,980,801 1,642,084 338,717 87,155 251,562 101,883 149,679 2007 $2,187,208 1,793,511 393,697 120,296 273,401 109,360 164,041 Depreciation Cash dividends declared 19,160 85,754 20,000 77,052 21,480 53,116 24,200 77,340 26,800 92,238 H Exhibit 5 FLINDER VALVES AND CONTROLS INC. Forecast Financial Statements for RSE International for the Years Ending December 31, 2007-12 (dollars in thousands except per-share figures) Sales Cost of goods sold Gross profit Selling, general, and admin. Income before tax Tax expense Net income Actual 2007 $2,187,208 1,793,510 393,698 120,296 273,402 109,361 164,041 2008 $2,329,373 1,920,085 409,288 129,786 279,502 111,801 167,701 2009 $2,480,785 2,064,243 416,542 139,481 277,061 110,824 166,237 Projected 2010 $2,642,037 2,216,470 425,567 151,027 274,540 109,816 164,724 2011 $2,813,769 2,367,290 446,479 161,315 285,164 114,066 171,098 2012 $2,996,658 2,537,259 459,399 169,826 289,573 115,829 173,744 Cash dividends 92,238 102,082 108,714 115,779 125,185 133,313 26,800 389,321 422,597 27,950 426,522 447,956 29,770 459,404 486,428 $2.58 $1.69 31,700 498,497 528,407 33,170 541,109 574,238 Depreciation Net PPE Net working capital Earnings per share Divs. per share common stock Div. per share preferred stock? 35,960 587,580 624,303 $2.62 $1.42 $0.40 $2.60 $1.58 $2.56 $1.80 $2.66 $1.94 $2.70 $2.07 162,694,361 common shares in 2007. Thereafter, 64,416,919 shares reflecting conversion of the preferred stock. 2 1,389,160 preferred shares in 2007. Conversion into 1,722,558 shares of common stock assumed in 2008. Exhibit 6 FLINDER VALVES AND CONTROLS INC. Market Prices of Flinder Valves and RSE International Corporation Flinder Valves and Controls Common Stock High Low Close $16.25 $8.75 $15.00 24.75 14.00 22.63 25.00 20.00 22.25 RSE International Corporation Common Stock Preferred Stock High Low Close High Low $12.31 $10.05 $11.88 14.36 11.77 13.16 12.81 9.27 11.13 2003 2004 2005 20.75 2006 Quarter Ended: March 31 June 30 September 30 December 31 20.38 24.38 22.75 22.75 24.36 21.50 21.00 21.50 14.13 13.69 12.83 12.39 12.83 12.04 10.48 11.26 13.95 11.78 11.26 11.87 20.38 20.13 21.00 20.00 2007 Quarter Ended: March 31 June 30 September 30 December 31 19.88 23.50 23.63 22.75 30.00 21.75 22.00 22.50 28.50 11.60 11.60 13.61 17.01 10.20 10.90 11.13 13.30 10.67 10.90 13.61 16.78 13.61 13.15 14.22 17.32 12.21 12.04 12.37 13.77 20.00 22.25 2008 Quarter Ended: March 31 32.13 26.00 31.50 20.73 15.08 20.69 17.32 13.98 May 1, 2008 $39.75 $38.90 $39.75 $22.58 $18.30 $21.98 $17.63 $15.35 Exhibit 7 FLINDER VALVES AND CONTROLS INC. Market Information on Firms in the Industrial Machinery Sector Price/ Earnings Expected Growth Dividend Rate Yield to 2010 Debt/Capital Ratio Beta 10.5 0.95 1.7% 5.1% 29% 17.2 1.0 0.7 12.3 36% 20.8 1.3 1.0 27.0 30% 10.9 1.3 Nil NMF 19% Cascade Corp. Manufactures loading engagement devices Curtiss-Wright Corporation Manufactures highly engineered, advanced technologies that perform critical functions Flowserve Corp. Makes, designs, and markets fluid handling equipment (pumps, valves, and mechanical seals) Gardner Denver Manufacturers stationary air compressors, vacuum products, and blowers Idex Corp. Manufactures a wide range of pumps and machinery products Roper Industries Manufacturers energy systems and controls, imaging equipment, and radio frequency products Tecumseh Products Manufactures compressors, condensers, and pumps Watts Industries Manufactures and sells and extensive line of valves for the plumbing and heating and water quality markets 16.1 1.05 1.5 10.8 22% 19.7 1.2 0.5 10.8 29% 38.2 1.05 Nil NMF 8% 15 1.3 1.5 8.4 32% NMF = not meaningful figure. Source: Value Line Investment Survey, April 25, 2008. Exhibit 8 FLINDER VALVES AND CONTROLS INC. Information on Selected Recent Related Mergers Effective Date Acquirer Business Target Business 5/25/06 6/26/06 9/20/06 11/10/06 12/8/06 4/11/07 6/22/07 7/31/07 12/3/07 12/20/07 2/6/08 6/5/08 Armor Holdings Inc. Bouygues S.A. Boeing Co. Daikin Industries Ltd. Oshkosh Truck Corp. Rank Group Ltd. Meggitt PLC BAE Systems Inc. Carlyle Group LLC ITT Corp. London Acquisition BV Ingersoll-Rand Co Ltd. Law enforcement equip Construction Aircraft Air conditioning sys Heavy duty trucks Investment holding co Aerospace/defense system Electronic systems Private equity firm Pumps/valves Investment holding co Industrial machinery/equip Stewart & Stevenson Alstom SA Aviall Inc OYL Industries Bhd JLG Industries Inc SIG Holding AG K&F Industries Holdings Armor Holdings Inc Sequa Corp EDO Corp Stork NV Trane Inc Turbine-driven products Power generation equip Vehicle parts Airconditioners Excavators/telehandlers Packaging/plastics machinery Aircraft braking systems Law enforcement equip Aircraft engine component Electn system products Components Airconditioners H Exhibit 8 (Continued) FLINDER VALVES AND CONTROLS INC. Information on Selected Recent Related Mergers Target Net Sales Last 12 Months ($mm) Equity Value/ Target Net Income Transaction Size (mm) Enterprise Value/ Target Operating Income Enterprise Valuel Target Net Sales Premium 4 Weeks Prior to Announcement Date (%) Enterprise Value/ Target Cash Flow Acquirer Target 726 65.3 nmf 28.9 1.12 1.48 1.53 27.6 1.41 Armor Holdings Inc. Bouygues S.A. Boeing Co. Daikin Industries Ltd. Oshkosh Truck Corp. Rank Group Ltd. Meggitt PLC BAE Systems Inc. Carlyle Group LLC ITT Corp. London Acquisition BV Ingersoll-Rand Co. Ltd. Stewart & Stevenson Alstom S.A. Aviall Inc. OYL Industries Bhd JLG Industries Inc. SIG Holding AG K&F Industries Holdings Armor Holdings Inc. Sequa Corp. EDO Corp. Stork NV Trane Inc. 1,123 2,467 2,057 1,152 3,252 2,314 1,802 4,328 2,007 1,678 2,347 9,751 17,679 1,371 1,581 2,289 1,418 424 2,805 2,181 945 2,153 8,328 20.5 38.6 20.3 30.5 34.4 86.8 17.1 21.2 1.30 1.56 4.26 1.71 1.25 1.99 0.02 1.39 33.1 77.9 18.7 21.5 11.9 64.8 13.1 17.1 20.6 34.0 23.7 22.5 14.9 16.8 10.7 14.2 10.8 14.3 12.5 23.9 40.6 -1.2 27.2 19.4 52.3 19.3 13.5 29.3 63.3 40.5 35.2 na na 11.6 14.9 na Exhibit 9 FLINDER VALVES AND CONTROLS INC. Capital Market Interest Rates and Stock Price Indexes (averages per annum, except April 2008, which offers closing values for April 25, 2008) 2006 2007 April 2008 U.S. Treasury Yields 3-month bills 30-year bonds 4.70% 5.00% 4.40% 4.91% 1.28% 4.52% Corporate Bond Yields by Rating A Baa 5.59% 5.80% 6.06% 6.48% 5.56% 5.90% 6.09% 6.48% 5.58% 5.96% 6.32% 6.98% Stock Market S&P 500 Index Price/earnings ratio 1,418 17.7% 1,468 18.3x 1,398 17.4x Industrial Machinery Stocks Price/earnings ratio Dividend yield 13.9x 1.4% 14.0x 1.4% Historical return premium of equity over government debt (1926-2007) Geometric average 5.5% Arithmetic average 7.2% Data Source: Value Line Investment Survey, April 25, 2008; Federal Reserve Bulletin; Compustat Exhibit 10 FLINDER VALVES AND CONTROLS INC. Forecast of Financial Statements for Flinder Valves and Controls for Years Ending December 31, 200812 (dollars in thousands) Sales Cost of goods sold Gross profit Selling, general, and administrative Other income-net Income before taxes Taxes Net income Actual 2007 $49,364 37,044 12,320 2,936 228 9,612 4,037 $5.575 2008 $59,600 43,816 15,784 3,612 240 12,412 4,965 $7,447 Projected 2009 2010 $66,000 $73,200 48,750 54,104 17,250 19,096 4,124 4,564 264 288 13,390 14,820 5,356 5,928 $8.034 $8.892 2011 $81,200 59,958 21,242 5,052 320 16,510 6,604 $9.906 2012 $90,000 66,200 23,800 5,692 352 18,460 7,384 $11,076 Depreciation $1,508 $1,660 $1,828 $2,012 $2,212 $2,432 Net PPE Net working capital $18,268 $16,840 $22,056 $20,331 $24,424 $22,515 $27,088 $24,971 $30,049 $27,700 $33,306 $30,702
Step by Step Solution
There are 3 Steps involved in it

Get step-by-step solutions from verified subject matter experts