Flow either side of a t-piece is shown in Figure 1. All flows are in the horizontal
Question:
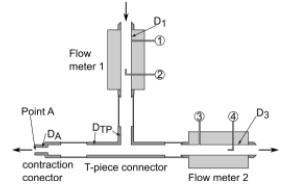
Flow either side of a t-piece is shown in Figure 1. All flows are in the horizontal plane. Pitot tube flow meters with pressure measurements are fitted to two of the branches (top and RHS) while the other branch (LHS) has a sudden flow contraction. Pressures are measured at 4 points (labelled 1-4). The loss coefficient of the contraction connector KL,cc is known but the loss coefficient of the T-piece KL,TP is not. The known values are given in Table 2. In your calculations use 1000 kg/m3 as the density of water.
P1 | 9180 Pa |
| D1, D3, DTP | 16 mm |
P2 | 10820 Pa | KL,CC * | 0.4 | |
P3 | 7840 Pa | DA | 11 mm | |
P4 | 8470 Pa | r (water) | 1000 kg/m3 | |
g | 9.81 m/s2 |
| m (water) | 1.2 x 10⁻³ Nsm-2 |
* Loss coefficient in contraction is based on the higher velocity
Table 2 Data for question 1
Calculate the following (you may assume major losses are negligible):
a) The velocities in the flow meters V1 and V3
b) The velocity after the contraction VA
c) The loss coefficient of the T-piece KL,TP (hint consider the flow between p1 and p3) where KL,TP is based on the outlet velocity
d) The pressure after the contraction pA
Expert Answer: