

Fly Can is a domestic airline, operated within the country. One of Fly Can's competitive priorities...
Fantastic news! We've Found the answer you've been seeking!
Question:
Transcribed Image Text:
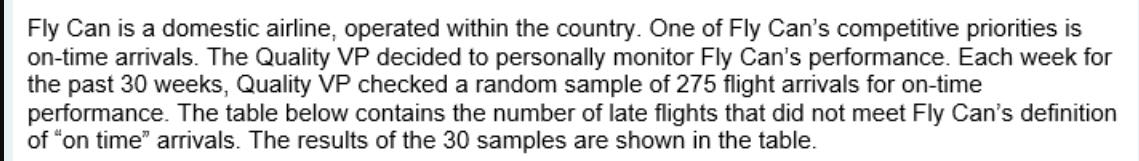
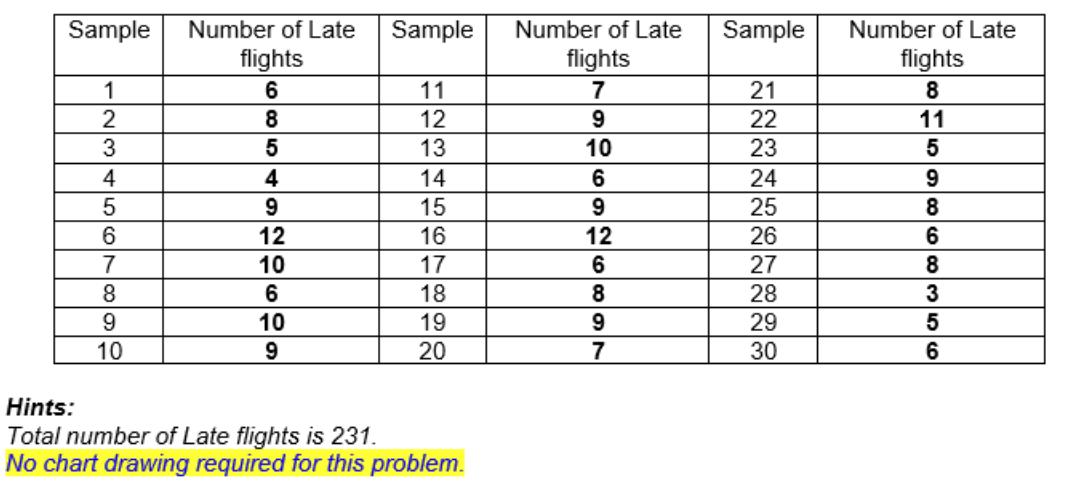
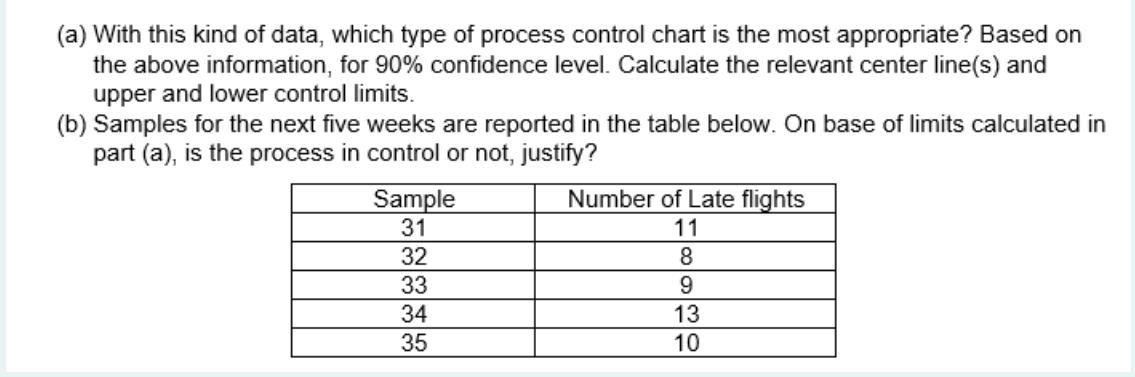
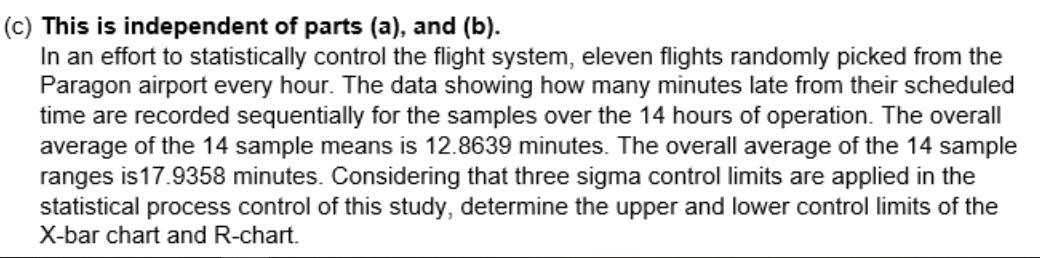
Fly Can is a domestic airline, operated within the country. One of Fly Can's competitive priorities is on-time arrivals. The Quality VP decided to personally monitor Fly Can's performance. Each week for the past 30 weeks, Quality VP checked a random sample of 275 flight arrivals for on-time performance. The table below contains the number of late flights that did not meet Fly Can's definition of "on time" arrivals. The results of the 30 samples are shown in the table. Sample Number of Late flights 6 1 2 3 4 5 6 7 8 9 10 8 5 4 9 12 10 6 10 9 Sample 11 12 13 14 15 16 17 18 19 20 Hints: Total number of Late flights is 231. No chart drawing required for this problem. Number of Late flights 7 9 10 6 9 12 6 8 9 7 Sample 21 22 23 24 25 26 27 28 29 30 Number of Late flights 8 11 5 9 8 6 8 3 5 6 (a) With this kind of data, which type of process control chart is the most appropriate? Based on the above information, for 90% confidence level. Calculate the relevant center line(s) and upper and lower control limits. (b) Samples for the next five weeks are reported in the table below. On base of limits calculated in part (a), is the process in control or not, justify? Sample 31 32 33 34 35 Number of Late flights 11 8 9 13 10 (c) This is independent of parts (a), and (b). In an effort to statistically control the flight system, eleven flights randomly picked from the Paragon airport every hour. The data showing how many minutes late from their scheduled time are recorded sequentially for the samples over the 14 hours of operation. The overall average of the 14 sample means is 12.8639 minutes. The overall average of the 14 sample ranges is 17.9358 minutes. Considering that three sigma control limits are applied in the statistical process control of this study, determine the upper and lower control limits of the X-bar chart and R-chart. Fly Can is a domestic airline, operated within the country. One of Fly Can's competitive priorities is on-time arrivals. The Quality VP decided to personally monitor Fly Can's performance. Each week for the past 30 weeks, Quality VP checked a random sample of 275 flight arrivals for on-time performance. The table below contains the number of late flights that did not meet Fly Can's definition of "on time" arrivals. The results of the 30 samples are shown in the table. Sample Number of Late flights 6 1 2 3 4 5 6 7 8 9 10 8 5 4 9 12 10 6 10 9 Sample 11 12 13 14 15 16 17 18 19 20 Hints: Total number of Late flights is 231. No chart drawing required for this problem. Number of Late flights 7 9 10 6 9 12 6 8 9 7 Sample 21 22 23 24 25 26 27 28 29 30 Number of Late flights 8 11 5 9 8 6 8 3 5 6 (a) With this kind of data, which type of process control chart is the most appropriate? Based on the above information, for 90% confidence level. Calculate the relevant center line(s) and upper and lower control limits. (b) Samples for the next five weeks are reported in the table below. On base of limits calculated in part (a), is the process in control or not, justify? Sample 31 32 33 34 35 Number of Late flights 11 8 9 13 10 (c) This is independent of parts (a), and (b). In an effort to statistically control the flight system, eleven flights randomly picked from the Paragon airport every hour. The data showing how many minutes late from their scheduled time are recorded sequentially for the samples over the 14 hours of operation. The overall average of the 14 sample means is 12.8639 minutes. The overall average of the 14 sample ranges is 17.9358 minutes. Considering that three sigma control limits are applied in the statistical process control of this study, determine the upper and lower control limits of the X-bar chart and R-chart. Fly Can is a domestic airline, operated within the country. One of Fly Can's competitive priorities is on-time arrivals. The Quality VP decided to personally monitor Fly Can's performance. Each week for the past 30 weeks, Quality VP checked a random sample of 275 flight arrivals for on-time performance. The table below contains the number of late flights that did not meet Fly Can's definition of "on time" arrivals. The results of the 30 samples are shown in the table. Sample Number of Late flights 6 1 2 3 4 5 6 7 8 9 10 8 5 4 9 12 10 6 10 9 Sample 11 12 13 14 15 16 17 18 19 20 Hints: Total number of Late flights is 231. No chart drawing required for this problem. Number of Late flights 7 9 10 6 9 12 6 8 9 7 Sample 21 22 23 24 25 26 27 28 29 30 Number of Late flights 8 11 5 9 8 6 8 3 5 6 (a) With this kind of data, which type of process control chart is the most appropriate? Based on the above information, for 90% confidence level. Calculate the relevant center line(s) and upper and lower control limits. (b) Samples for the next five weeks are reported in the table below. On base of limits calculated in part (a), is the process in control or not, justify? Sample 31 32 33 34 35 Number of Late flights 11 8 9 13 10 (c) This is independent of parts (a), and (b). In an effort to statistically control the flight system, eleven flights randomly picked from the Paragon airport every hour. The data showing how many minutes late from their scheduled time are recorded sequentially for the samples over the 14 hours of operation. The overall average of the 14 sample means is 12.8639 minutes. The overall average of the 14 sample ranges is 17.9358 minutes. Considering that three sigma control limits are applied in the statistical process control of this study, determine the upper and lower control limits of the X-bar chart and R-chart. Fly Can is a domestic airline, operated within the country. One of Fly Can's competitive priorities is on-time arrivals. The Quality VP decided to personally monitor Fly Can's performance. Each week for the past 30 weeks, Quality VP checked a random sample of 275 flight arrivals for on-time performance. The table below contains the number of late flights that did not meet Fly Can's definition of "on time" arrivals. The results of the 30 samples are shown in the table. Sample Number of Late flights 6 1 2 3 4 5 6 7 8 9 10 8 5 4 9 12 10 6 10 9 Sample 11 12 13 14 15 16 17 18 19 20 Hints: Total number of Late flights is 231. No chart drawing required for this problem. Number of Late flights 7 9 10 6 9 12 6 8 9 7 Sample 21 22 23 24 25 26 27 28 29 30 Number of Late flights 8 11 5 9 8 6 8 3 5 6 (a) With this kind of data, which type of process control chart is the most appropriate? Based on the above information, for 90% confidence level. Calculate the relevant center line(s) and upper and lower control limits. (b) Samples for the next five weeks are reported in the table below. On base of limits calculated in part (a), is the process in control or not, justify? Sample 31 32 33 34 35 Number of Late flights 11 8 9 13 10 (c) This is independent of parts (a), and (b). In an effort to statistically control the flight system, eleven flights randomly picked from the Paragon airport every hour. The data showing how many minutes late from their scheduled time are recorded sequentially for the samples over the 14 hours of operation. The overall average of the 14 sample means is 12.8639 minutes. The overall average of the 14 sample ranges is 17.9358 minutes. Considering that three sigma control limits are applied in the statistical process control of this study, determine the upper and lower control limits of the X-bar chart and R-chart.
Expert Answer:
Answer rating: 100% (QA)
a With this kind of data which type of process control chart is the most appropriate Based on the above information for a 90 confidence level Calculate the relevant center lines and upper and lower co... View the full answer

Related Book For 

Posted Date:
Students also viewed these general management questions
-
Given independent random variables, X and Y, with means and standard deviations as shown, find the mean and standard deviation of each of the variables in parts a to d a) X-11 b) 0.4Y c) X+Y d) X-Y...
-
One of Alabama Airs top competitive priorities is on-time arrivals. Quality V.P Mike Hanna decided to personally monitor Alabama Airs performance. Each week for the past 30 weeks, Hanna checked a...
-
One of New England Airs top competitive pri-orities is on- time arrivals. Quality VP Clair Bond decided to person-ally monitor New England Airs performance. Each week for the past 30 weeks, Bond...
-
Classify each of the following items as a public good, a private good, a mixed good, or a common resource. Georges Banks cod stock A courtside seat at the U.S. Open (tennis) A well-stocked buffet...
-
The Ford Motor Company operates two segments (Ford refers to its segments as "sectors"). Using the company's website, locate sector information for 2015 in the company's 2015 annual report....
-
Describe the three important functions of DnaA protein.
-
What are the two purposes of taking a deposition?
-
Use the Internet to locate www.cia.gov and www.Amazon.com. Find the privacy and security policies for each. Compare and contrast the use of privacy statements, encryption, SSL, and cookie policies.
-
The family of 70 year old Mr. B came to the NP to discuss a recent discovery that Mr. B has Huntington's disease. Mr. B has had tremors for many years, which were thought to be due to prior alcohol...
-
Hastings Company bases its variable overhead performance report on the actual direct labour- hours of the period. Data concerning the most recent year, which ended on December 31, are as follows:...
-
The surface area of a sphere inscribed in a regular tetrahedron is 144 cm? 21. What is the radius of the sphere? a) 12 cm 22. What is the altitude of the tetrahedron?. a) 20 cm 23. If a sphere is...
-
calculate the annual rate of return what annual rate of return is earned on a $5,000 investment when it grows to $10,750 in six years?
-
An electric charge of 1.20 X 10-C is fixed at each corner of a rectangle 30.0 cm wide and 40 cm long. (k = 9x 10N m/C) What is the magnitude and direction of the electric force on each charge?
-
Find the present value of an annuity with payments of $1,250 at the end of each year for 7 years. The interest rate is 5% compounded annually.
-
How do studies on ancient DNA and paleogenomics contribute to our understanding of human evolution and the interbreeding events between Homo sapiens and archaic hominins such as Neanderthals and...
-
On August 22, 2024, Pharoah Manufacturing sold, on account, one of its Model S14 bulldozers including a 5-year service contract for $227,000. The stand-alone price of the equipment is $186,000 and...
-
Why did convertible bonds perform poorly in 2008 and then perform very well in 2009? Why did convertible arbitrage strategies do poorly in 2008? We have the following information: Conversion ratio=...
-
Making use of the tables of atomic masses, find the velocity with which the products of the reaction B10 (n, ) Li7 come apart; the reaction proceeds via interaction of very slow neutrons with...
-
What are some of the uses to which labor standards are put?
-
Master schedules are expressed in three different ways depending on whether the process is continuous, a job shop, or repetitive. What are these three ways?
-
Use Pareto analysis to investigate the following data collected on a printed-circuit-board assembly line: Number of Defect Defect Occurrences Components not adhering............ 143...
-
Calculate the residual enthalpy and entropy for propane at \(312 \mathrm{~K}\) and \(2 \mathrm{MPa}\) using the van der Waals equation of state, given that \(a=0.877 \mathrm{~Pa}\left(\mathrm{~m}^{3}...
-
Using the generalized virial coefficient of correlation, estimate the residual enthalpy and entropy for ethylene at \(339.7 \mathrm{~K}\) and \(1 \mathrm{bar}\), given that \(T_{\mathrm{C}}=283...
-
Derive an expression to calculate the change in enthalpy and entropy of a real gas obeying the following equation of state along an isothermal path between the initial and final pressures \(P_{1}\)...

Study smarter with the SolutionInn App