

Question: follow the instruction and complete the following C program Partially completed program: /*------------------------------------------------------------------ File: plotFunctions.c Author: Gilbert Arbez, Fall 2016 Description: Allows the user to
follow the instruction and complete the following C program
Partially completed program:
/*------------------------------------------------------------------
File: plotFunctions.c
Author: Gilbert Arbez, Fall 2016
Description: Allows the user to plot a number of functions for
different ranges.
---------------------------------------------------------------------*/
#include
#include
#include
#include
// Some definitions
#define NUM_POINTS 500 // Number of points used for plotting
#define X_IX 0 // Row index for storing x values
#define FX_IX 1 // Row index for storing f(x) values
#define TRUE 1
#define FALSE 0
// Structure for user input
typedef struct
{
int fNumber; // function number
double x0; // first value of x to plot
double xf; // final value of x to plot
} F_SELECT;
// function prototypes
void selectFunction(F_SELECT *);
void computeDataPoints(F_SELECT *fsPtr, int n, double [][n]);
double calcFx(double, int);
void plot(int n, double [][n]);
double getMinDouble(double [], int);
double getMaxDouble(double [], int);
/*---------------------------------------------------------------------
Function: main
Description: This function computes a set of points for plotting. The
function calcFx is called to computes the value of f(x) .
Modify calcFx to compute the values of f(x) desired.
In this template, the sin function is used.
------------------------------------------------------------------------*/
void main(void)
{
// Variable declarations
F_SELECT fselect;
double points[2][NUM_POINTS]; // row 0 contains values of x
// Get user input
selectFunction(&fselect);
// Compute the data points and save in array
computeDataPoints(&fselect, NUM_POINTS, points);
// Call plot function to plot
plot(NUM_POINTS, points);
}
/*-----------------------------------------------------------------------
Function: selectFunction
Parameters:
sfPtr - Pointer to F_SELECT structure variable to store input data.
Description: Prompts the user to get x0 and xf (range of x for plotting)
and to select a function to plot.
------------------------------------------------------------------------*/
void selectFunction(F_SELECT *sfPtr)
{
// Variable Declarations
int flag;
// Display function menu
printf("1) f(x) = sqrt(|x-1|) + 1 ");
printf("2) f(x) = exp(-x) ");
printf("3) f(x) = sqrt(x^2+1) - x ");
printf("4) f(x) = [exp(-x) - 1)]/x ");
printf("5) f(x) = sin(x)+0.1*cos(10.0*x) ");
// Select a function
// Select a range of x for plotting
}
/*-----------------------------------------------------------------------
Function: computeDataPoints
Parameters:
fsPtr - Pointer to F_SELECT structure variable with input data.
n - number of points in the 2D array (i.e. number of columns)
points - 2D array that contains the data points - row X_IX with x values
and row FX_IX with the f(x) values.
Description: Calculates NUM_POINTS points of the function f(x) (selected by the
the user and computed with calcFx), and stored in the
2D array points. points[X_IX] is the 1D array (row X_IX) that
contains the x values while points[FX_IX] is the 1D array (row FX_IX)
that contains the f(x) values.
------------------------------------------------------------------------*/
void computeDataPoints(F_SELECT *fsPtr, int n, double points[][n])
{
int ix; // for indexing points, i.e. columns of 2D array
double x; // for incrementing the value of x
double inc; // incrementation value of x
// Setup loop that computes the points and stores in 2D array
// A determinant loop is used to increment x, calculate f(x)
// and store the values in the 2D array.
}
/*-----------------------------------------------------------------------
Function: calcFx
Parameters:
x - the value of x
funtionNum - function number to select function for calculation
Return: The value of f(x)
Description: Calculates the value of f(x). In this case f(x) is selected
using functionNum.
------------------------------------------------------------------------*/
double calcFx(double x)
{
// Variable declations
double fx;
// Instructions
fx = sin(x);
return(fx);
}
/*-------------------------------------------------
Function: plot()
Parameters:
numPoints: number of points in the array, i.e. number of columns
points: reference to 2D array
Return value: none.
Description: Initializes the plot. The following values
in the referenced structure are used to setup
the plot:
points[X_IX][0], points[X_IX][nbrPoints-1] range of horizontal axis
minFx, maxFx - vertical axis range
Note the that the values of minFx and maxFx are determined with
the functions getMinDouble and getMaxDouble. The values in the row
X_IX are assumed to be sorted in increasing order.
Then plots the curve accessed using the contents of each row,
that is, points[X_IX] and points[FX_IX] which are both references
to 1D arrays.
-------------------------------------------------*/
void plot(int numPoints, double points[][numPoints])
{
// Variable declaration
double minFx, maxFx; // Minimum and maximum values of f(x)
// Setup plot configuration
plsdev("wingcc"); // Sets device to wingcc - CodeBlocks compiler
// Initialize the plot
plinit();
// Configure the axis and labels
plwidth(3); // select the width of the pen
minFx = getMinDouble(points[FX_IX], numPoints);
maxFx = getMaxDouble(points[FX_IX], numPoints);
plenv(points[X_IX][0],points[X_IX][numPoints-1],
minFx, maxFx, 0, 0);
plcol0(GREEN); // Select color for labels
pllab("x", "f(x)", "Plot of f(x) versus x");
// Plot the function.
plcol0(BLUE); // Color for plotting curve
plline(numPoints, points[X_IX], points[FX_IX]);
plend();
}
/*-------------------------------------------------
Function: getMinDouble
Parameters:
arr: reference to array of double values
n: number of elements in the array
Return value: the smallest value found in the array.
Description: Finds the smallest value in the array.
Uses a determinate loop to traverse the array
to test each value in the array.
-------------------------------------------------*/
double getMinDouble(double arr[], int n)
{
// Variable declarations
double min; // for storing minimum value
int ix; // indexing into an array
// Instructions
min = DBL_MAX; // most positive value for type double
for(ix = 0; ix
{
if(min > arr[ix]) min = arr[ix];
}
return(min);
}
/*-------------------------------------------------
Function: getMaxDouble
Parameters:
arr: reference to array of double values
n: number of elements in the array
Return value: the largest value found in the array.
Description: Finds the largest value in the array.
Uses a determinate loop to traverse the array
to test each value in the array.
-------------------------------------------------*/
double getMaxDouble(double arr[], int n)
{
// Variable declarations
double max; // for storing maximum value
int ix; // indexing into an array
// Instructions
max = -DBL_MAX; // most negative value for type double
for(ix = 0; ix
{
if(max
}
return(max);
}
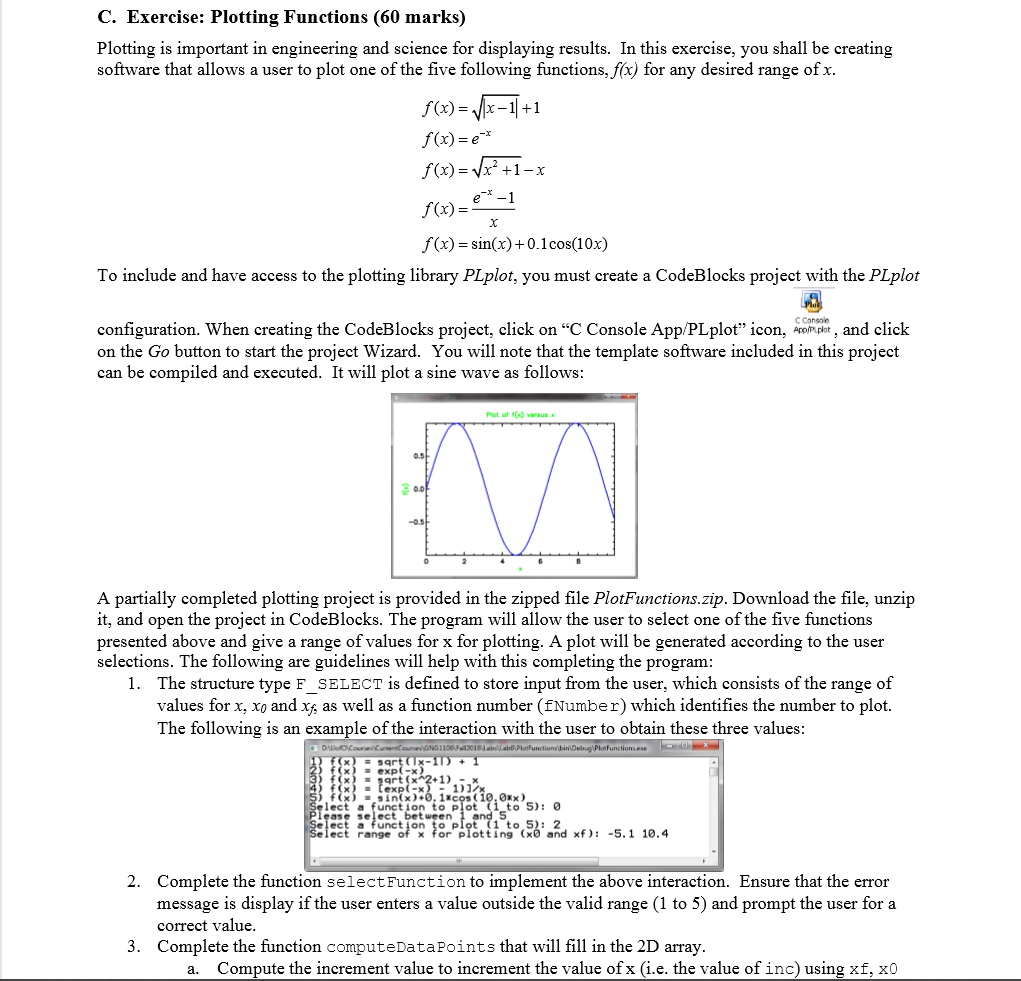
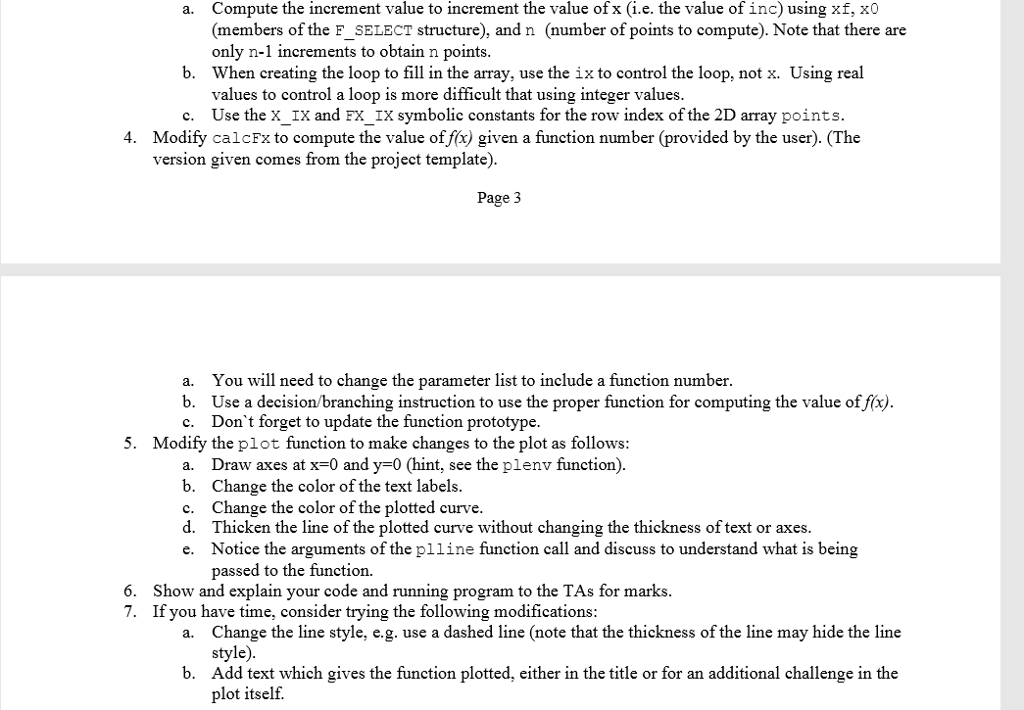
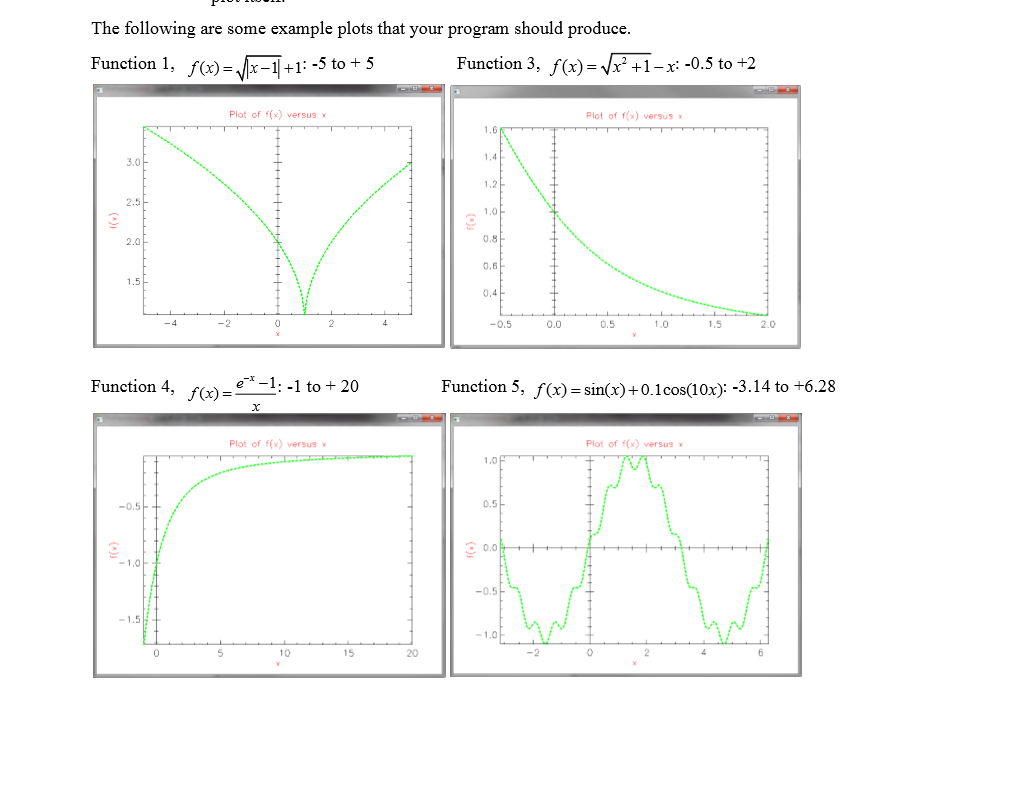
C. Exercise: Plotting Functions (60 marks) Plotting is important in engineering and science for displaying results. In this exercise, you shall be creating software that allows a user to plot one of the five following functions, fx) for any desired range ofx f(x)+1 f(x)=e f(x) = x2 +1-x f (x)sin(x) + 0.1cos(10x) To include and have access to the plotting library PLplot, you must create a CodeBlocks project with the PLplot configuration. When creating the CodeBlocks project, click on "C Console App/PLplot" icon, and click on the Go button to start the project Wizard. You will note that the template software included in this project can be compiled and executed. It will plot a sine wave as follows Plot of t(x)versusx A partially completed plotting project is provided in the zipped file PlotFunctions.zip. Download the file, unzip it, and open the project in CodeBlocks. The program will allow the user to select one of the five functions presented above and give a range of values for x for plotting. A plot will be generated according to the user selections. The following are guidelines will help with this completing the program The structure type F_SELECT is defined to store input from the user, which consists of the range of values for x, xo and x, as well as a function number (fNumber) which identifies the number to plot. The following is an example of the interaction with the user to obtain these three values 1. x) text (-"2+ 1 ) 1) function to plot : (x)-sin( x ) +0. licos ( 10.0#x ) ase select bet ween ect range of x for plotting (x0 and xf): lect a ttinto.and xf): -5.1 10.4 -5.1 10.4 Complete the function selectFunction to implement the above interaction. Ensure that the error message is display if the user enters a value outside the valid range (1 to 5) and prompt the user for a correct value Complete the function computeDataPoints that will fill in the 2D array 2. 3. a. Compute the increment value to increment the value of x (i.e. the value of inc) using xf, x0 C. Exercise: Plotting Functions (60 marks) Plotting is important in engineering and science for displaying results. In this exercise, you shall be creating software that allows a user to plot one of the five following functions, fx) for any desired range ofx f(x)+1 f(x)=e f(x) = x2 +1-x f (x)sin(x) + 0.1cos(10x) To include and have access to the plotting library PLplot, you must create a CodeBlocks project with the PLplot configuration. When creating the CodeBlocks project, click on "C Console App/PLplot" icon, and click on the Go button to start the project Wizard. You will note that the template software included in this project can be compiled and executed. It will plot a sine wave as follows Plot of t(x)versusx A partially completed plotting project is provided in the zipped file PlotFunctions.zip. Download the file, unzip it, and open the project in CodeBlocks. The program will allow the user to select one of the five functions presented above and give a range of values for x for plotting. A plot will be generated according to the user selections. The following are guidelines will help with this completing the program The structure type F_SELECT is defined to store input from the user, which consists of the range of values for x, xo and x, as well as a function number (fNumber) which identifies the number to plot. The following is an example of the interaction with the user to obtain these three values 1. x) text (-"2+ 1 ) 1) function to plot : (x)-sin( x ) +0. licos ( 10.0#x ) ase select bet ween ect range of x for plotting (x0 and xf): lect a ttinto.and xf): -5.1 10.4 -5.1 10.4 Complete the function selectFunction to implement the above interaction. Ensure that the error message is display if the user enters a value outside the valid range (1 to 5) and prompt the user for a correct value Complete the function computeDataPoints that will fill in the 2D array 2. 3. a. Compute the increment value to increment the value of x (i.e. the value of inc) using xf, x0
Step by Step Solution
There are 3 Steps involved in it

Get step-by-step solutions from verified subject matter experts