

Question: follow the instructions given TEST II: Modified TRUE or FALSE Write True if the statement is true. If the statement is false change the underlined
follow the instructions given

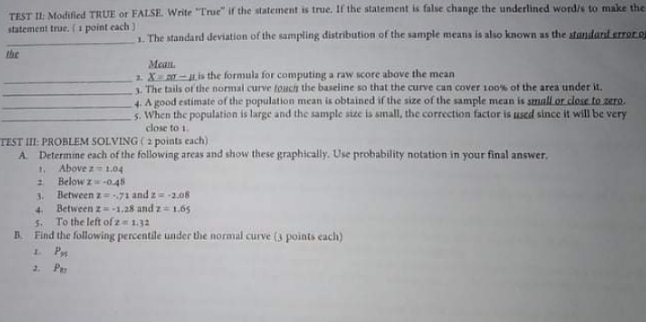
TEST II: Modified TRUE or FALSE Write "True" if the statement is true. If the statement is false change the underlined word/s to make the statement true. [ 1 point each ] 1. The standard deviation of the sampling distribution of the sample means is also known as the standard error of 1. X 3 - jib the formula for computing a raw score above the mean 1. The tails of the normal curve fouch the baseline so that the curve can cover 100% of the area under it. 4. A good estimate of the population mean is obtained if the size of the sample mean is small or close to zero. 5. When the population is large and the sample size is small, the correction factor is used since it will be very close to 1. TEST III: PROBLEM SOLVING ( a points each) A. Determine each of the following areas and show these graphically. Use probability notation in your final answer. Above 2 - 1.04 Below I -0.45 Between 2= - 71 and 20-2.08 Between 2 = =1,28 and 2 = 1.05 J. To the left of z = 1.32 B. Find the following percentile under the normal curve (3 points each)
Step by Step Solution
There are 3 Steps involved in it

Get step-by-step solutions from verified subject matter experts