

Question: Following table shows MPS for a specific product ( P 1 ) for twelve months. table [ [ , Month,, ] , [ 1
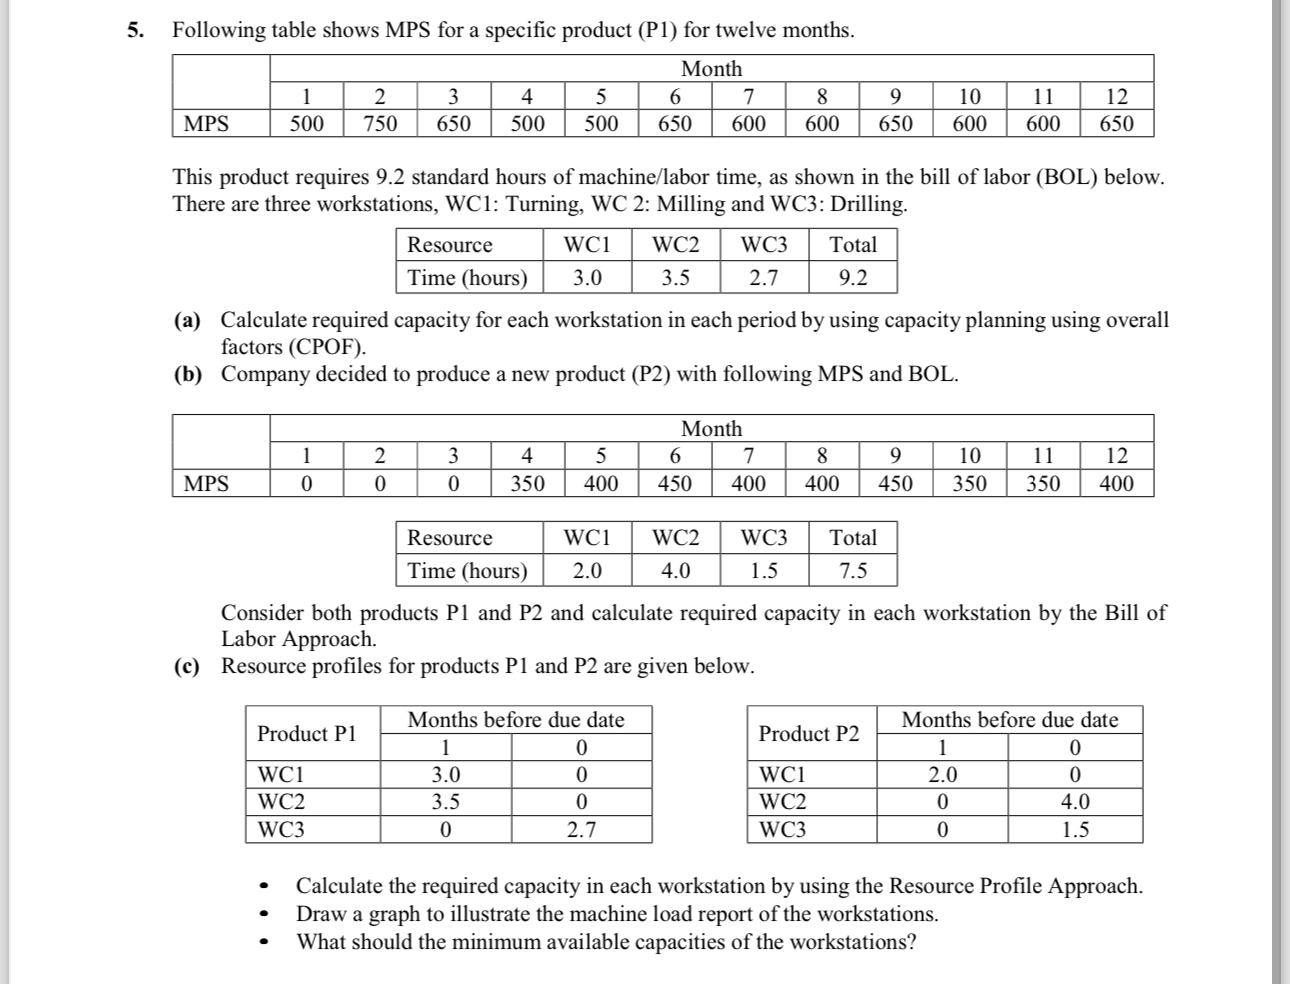
Following table shows MPS for a specific product P for twelve months.
tableMonth,,MPS
This product requires standard hours of machinelabor time, as shown in the bill of labor BOL below. There are three workstations, WC: Turning, WC : Milling and WC: Drilling.
tableResourceWCWCWCTotalTime hours
a Calculate required capacity for each workstation in each period by using capacity planning using overall factors CPOF
b Company decided to produce a new product P with following MPS and BOL.
tableMonth,,MPS
tableResourceWCWCWCTotalTime hours
Consider both products P and P and calculate required capacity in each workstation by the Bill of Labor Approach.
c Resource profiles for products P and P are given below.
tableProduct PMonths before due dateWCWCWC
tableProduct PMonths before due dateWCWCWC
Calculate the required capacity in each workstation by using the Resource Profile Approach.
Draw a graph to illustrate the machine load report of the workstations.
What should the minimum available capacities of the workstations?
Step by Step Solution
There are 3 Steps involved in it
1 Expert Approved Answer
Step: 1 Unlock

Question Has Been Solved by an Expert!
Get step-by-step solutions from verified subject matter experts
Step: 2 Unlock
Step: 3 Unlock