

Question: Following table shows the data from 50 weeks on Air-filter sales of an Auto-repair shop in the midwest. Number of filters sold in a week

Following table shows the data from 50 weeks on Air-filter sales of an Auto-repair shop in the midwest. Number of filters sold in a week Number of weeks this number was sold 4 5 5 7 6 11 7 14 8 11 9 8 10 4 a. For the above table, calculate the probabilities and cumulative probabilities for the number of filters sold in a week. b. Simulate the shop's filter sales for a period of 2 years (104 weeks). c. What is the average number of sales based on your simulation? d. What is the expected number of sales based on the probabilities you calculated in part (a). Is this number same as your answer for part (c)? Why/ Why not?
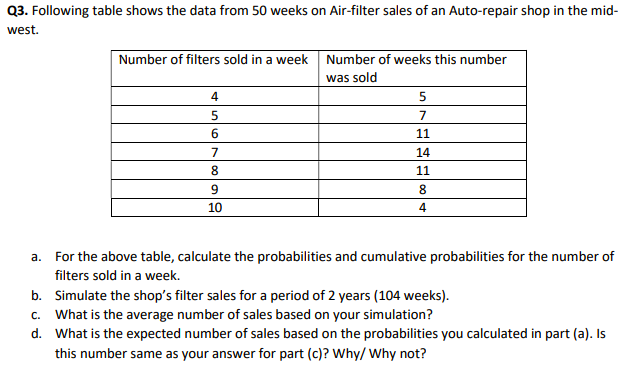
Q3. Following table shows the data from 50 weeks on Air-filter sales of an Auto-repair shop in the mid- west. Number of filters sold in a week Number of weeks this number was sold 4 5 5 7 6 11 7 14 8 11 9 8 10 4 a. For the above table, calculate the probabilities and cumulative probabilities for the number of filters sold in a week. b. Simulate the shop's filter sales for a period of 2 years (104 weeks). c. What is the average number of sales based on your simulation? d. What is the expected number of sales based on the probabilities you calculated in part (a). Is this number same as your answer for part (c)? Why/ Why not
Step by Step Solution
There are 3 Steps involved in it

Get step-by-step solutions from verified subject matter experts