

Question: footnote 6 footnote 15 Case,01, Buffert,2015 ohibts epanded-3ax Protected View Excel share ||Comments Draw Page Layout Formulas Data Review View Help Search arelu-Eles from the
 footnote 6
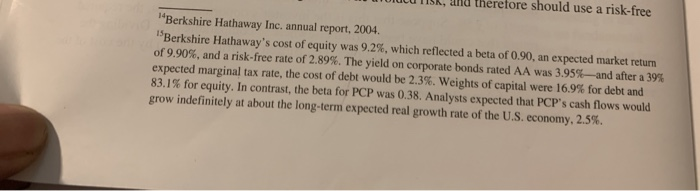 footnote 15
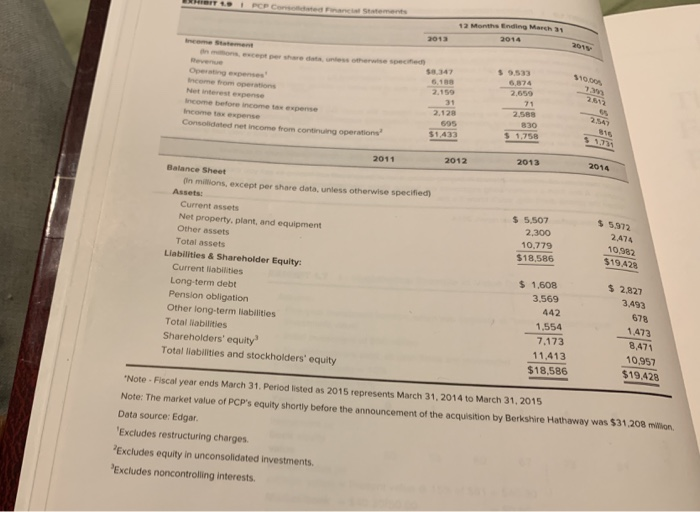
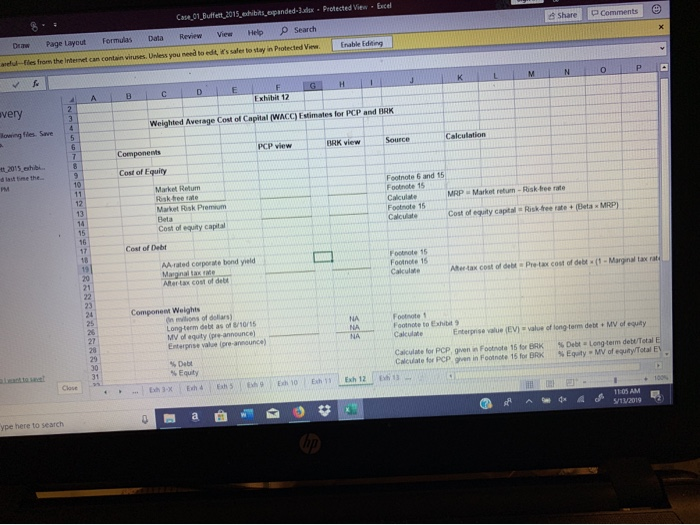
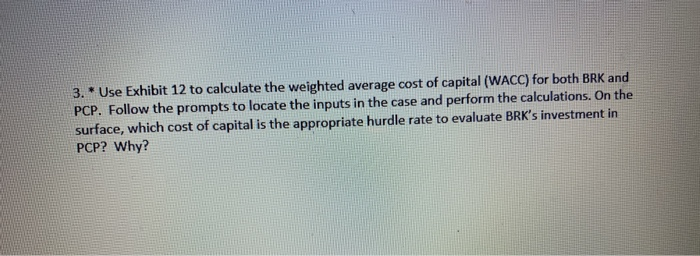
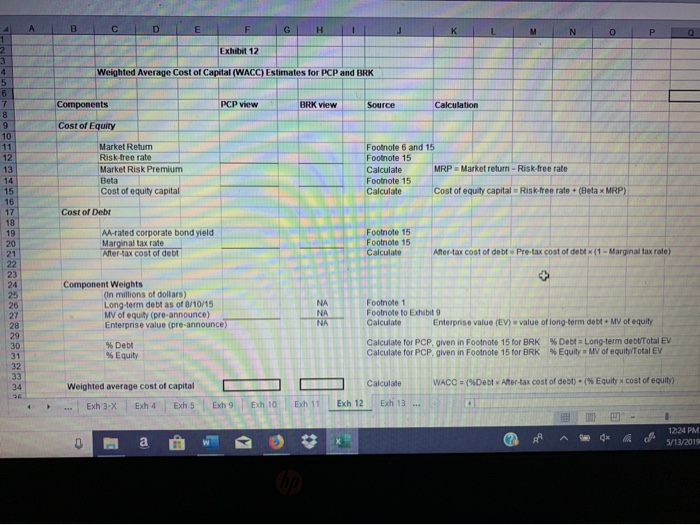
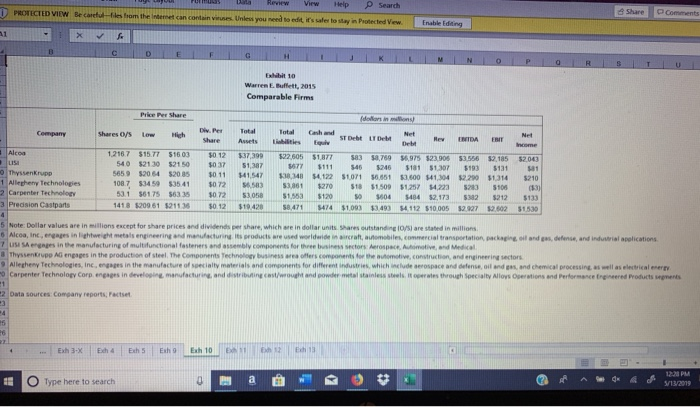
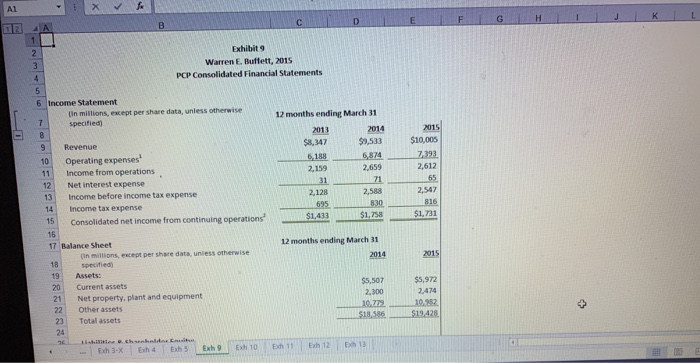
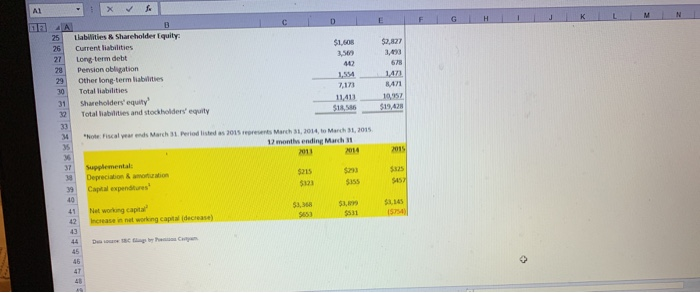
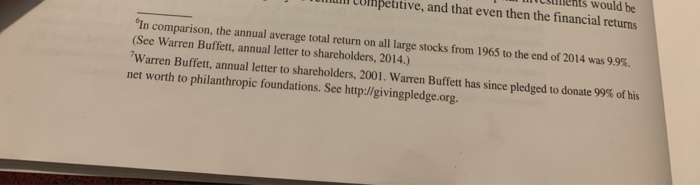
Case,01, Buffert,2015 ohibts epanded-3ax Protected View Excel share ||Comments Draw Page Layout Formulas Data Review View Help Search arelu-Eles from the Internet can contain viruses. Unless you need to edt, its saler to stay in Protected VierEnable Edting Exhibit 12 very lowing files. Save Weighted Average Cost of Capital (WACC) Estimates for PCP and BRK BRK view Source PCP view Components Cost of Equity 10 Footnote 6 and 15 Footnote 15 Market Return Market Roisk Premium Cost of equity capital Calculate 12 13 14 15 16 MRP Market return -Risk-ree rate Footnote 15 Calculate Cost of equity capital Risk-tree rate(Beta MRP Cost of Debt Footnote 15 Footnote 15 Caculate A-rated corporate bond yield Maignal tax me Ater tax cost of debe 19 Atee4ax cost of debt . Pre-tax cost of debt-11-Margnal tax rat 21 n mtions of doliars) Long-term debt as of 810/ MV of equty (pre-announce) Enterpise vaue (pre-anounce) Footnote 1 CakculateEnterprise value (EV)value of long-term debt + MV of equiy Calculate for PCP gnern Footnote 15 for BRK % Debt . Long-term debt/Total NA AFootnote to Exhib9 29 30 %Debt %Equity %Eqty . MV of equity Total Ey Calculate for PCP g ven in Footnote 15 for BRK Close s ype here to search 3. * Use Exhibit 12 to calculate the weighted average cost of capital (WACC) for both BRK and PCP. Follow the prompts to locate the inputs in the case and perform the calculations. On the surface, which cost of capital is the appropriate hurdle rate to evaluate BRK's investment in PCP? Why? NOP Exhibit 12 Weighted Average Cost of Capital (WACC) Estimates for PCP and BRK Components PCP view BRK view Source Calculation Cost of Equity 10 Market Return Risk-free rate Market Risk Premium Beta Cost of equity capital Footnote 6 and 1 12 13 ootnote 15 Calculate Footnote 15 Calculate MRP Market return-Risk-free rate Cost of equity capital Risk-free rate(Beta x MRP) 15 16 17 18 19 20 21 Cost of Debr AA-rated corporate bond yield Marginal tax rate After-tax cost of debt Footnote 15 Footnote 15 Calculate After-tax cost of debt Pre-tax cost of debtx(1-Marginal tax rate) 23 24 25 26 27 28 29 30 31 Component Weights In millions of dollars) ong-term debt as of 8/10/15 MV of equity (pre-announce) Enterprise value (pre-announce) Footnote 1 Footnote to Exh bit CalculateEnterprise value (EV) value of long-term debt MV of equity NA NA % Debts Long-term debt/Total EV % Equity = MV of equity/Total EV Calculate for PCP, given in Footnote 15 for BRK Calculate for PCP, given in Footnote 15 for BRK % Debt % Equity 32 WACCH%DettrMer tax cost of debt-(% Equity x cost or equity) calculate Weighted average cost of capital Exh 3-XExh 4 Exh S Exh 9 Exh 10 Exh 11 Exh 12 Exh 1 :. 1224 PM 5/13/2019 39 40 Miscellaneous information for reality check (in millions)-- # shares ve Exhibit 10 Footnote 5 Footnote 5 Paragraph 1 Paragraph 1 Paragraph 1 Market price 8/7/15 Market price 8/1015 BRK bid price Equity value of deal Total EV of deal 42 43 46 49 50 52 53 56 57 58 59 60 61 62 63 64 65 tia Review View Help Search PROTECTED VIEW Be ca Share -files from the I ncan condain viues Unless you need to edit, it's safer to stay in Protected Vew Enable Edding Exhibit 10 Warren E. Bufflett, 2015 Comparable Firms Div Per TotalTotal Compamy Shares oys Low Hich Debe Rew NIDA ENI Net 2167 $15.77 $16 03 0 12 $37,399 $22,605 $1,877 $83 $8,769 $6.975 $23.906 $3556 $2,185 $2043 $677 $111 $46 S246 S181 $1.307 %193 s131 sal 5659 $20 64 $20 85 50 11 $41547 $3.348 $4 122 $1071 6651 $3,600 41304 $220 $1,314 $210 108 7 $3459 $3541 072 3$3361 $270 $18 $1.509 125 422 523 108. 631 56175 563 35 072 53058 51.053$120o 04 484 $2.173 $382 $212 $133 418 $209 61 $21136 $0.12 $19 428 $8,471 474 $1,093 $3493 4 112 $10.005 $2.927 $2.602 $1.530 Share Assets lEqui 40 $21.30 2150 037 $1,387 O Thyssenkrupp 1 Allesheny Technologies 2 Carpenter Technology 3 Predision Castparts1 Note Dollar values are in millions except for share prices aed dividends per share, which "re in dollar units sares outstanding losi are stated in millions Alcoa, inc,engages in lightweight metals engineering and manufacturing its groducts are used woldde iircraft, automabiles, commercial transpertation, packaging eil and gas, defense, and induutrial apelications 7 lus, sengnges in manufacturing of multifunctional "asteners and assembly compoerts fothree bains sectors Aerospace-me-and Med-al a Thyssenkrupo AG engsges in the production of steel. The Components Technoloy business area offlers components for the ausmotive, construction, and engineering sectors O Carpenter Technology Corp engages in drveloome. mar facture and d strib nangcas' wo M a d po der metal stainless steel. Itierates through Specialty Ali0ys .ation.. d Peder-e ce t e een.ourts see en. 2Data sources Company reports, Factset Allerhe y Tech engages in the manufac s re o, senialty material, and components fo' dimerent industries which-ul de aerospace and delense, ol 'ed en and che o ogies, inc cal processingS-l ai-ti-l en 1228 PM O Type here to search Exhibit 9 Warren E, Buftett, 2015 PCP Consolidated Financial Statements 6 Income Statement IIn millions, except per share data, unless otherwise specified) 12 months ending March 31 20132014 2015 $8,347$9,533$10,005 9 Revenue 10 Operating expenses 11 Income from operations 12 Net interest expense 13 Income before income tax expense 14 Income tax expense 15 Consolidated net income from continuing operations 2,612 7165 2,547 2,159 2,659 2,128 $1,43351175851.761 17 Balance Sheet 12 months ending March 31 (in mvillions, except per share data, unless otherwise 19 Assets: 20 Current assets 21 Net property, plant and equipment 22 Other assets 23 Total assets 24 $5,972 2,300 $18,586$19,428 25 Llabities & Shareholder Equity 26 Current liabilities 27 Long-term deblt 28 Pension obligation 29 Other long-term liabilities 30 Total liabilities 31 Shareholders' equity 32Total iabilities and stockholders' equity $1,608 $2,827 1,43 8471 11,413 4 "Note Fiscal year ends March 31. Period listed as 2015 reprevents March 31,2014, to March 31, 2015 12 months ending March Depreciation& amortiuzation $325 al expenditures 1 Net working capital 53,368 1,145 $1,89 tiients would be llI Competitive, and that even then the financial returns ern comparison, the annual average total return on all large stocks from 1965 to the end of 2014 was 99%. (See Warren Buffett, annual letter to shareholders, 2014.) 'Warren Buffett, annual letter to shareholders, 2001 . Warren Buffett has since pledged to donate 99% of his net worth to philanthropic foundations. See http://givingpledge.org. lucu Tisk, and therefore should use a risk-free Berkshire Hathaway Inc. annual report, 2004. "Berkshire Hathaway's cost of equity was 9.2%, which reflected a beta of 0.90, an expected market return of 9.90%, and a risk-free rate of 2.89%. The yield on corporate bonds rated AA was 3.95%-and after a 39% expected marginal tax rate, the cost of debt would be 2.3%. weights of capital were 16.9% for debt and 83.1% for equity. In contrast, the beta for PCP was 0.38. Analysts expected that PCP's cash flows would grow indefinitely at about the long-term expected real growth rate of the US, economy, 2.5%. 12 Months Ending March 31 th mmions, except per share data, uness oftherwise specified) 9533 6,874 2.659 10.00 6.188 2.159 2812 income from operations Net interest expense 2.588 830 2547 816 2.128 income before income tax expense Income tax e 1,433 net income from continuing operations 2014 2013 2012 2011 Balance Sheet in millions, except per share data, unless otherwise specified) Assets: $ 5.972 2,474 10,982 $ 5,507 Current assets Net property. plant, and equipment Other assets Total assets 2,300 10,779 $18,586 $18.586 $1922 Liabilities & Shareholder Equity: $ 2.827 $ 1,608 Current Ilabilities Long-term debt Pension obligation Other long-term iabilities Total liabilities Shareholders' equity Total liabilities and stockholders' equity 3.569 442 3,493 678 473 8471 10,957 $19.428 1,554 7.173 11.413 $18,586 Note-Fiscal year ends March 31. Period isted as 2015 represents March 31, 2014 to March 31,2015 Note: The market value of PCP's equity shortly before the announcement of the acquisition by Berkshire Hathaway was $31.208 mition. Data source: Edgar. Excludes restructuring charges Excludes equity in unconsolidated investments. Excludes noncontroling interests Case,01, Buffert,2015 ohibts epanded-3ax Protected View Excel share ||Comments Draw Page Layout Formulas Data Review View Help Search arelu-Eles from the Internet can contain viruses. Unless you need to edt, its saler to stay in Protected VierEnable Edting Exhibit 12 very lowing files. Save Weighted Average Cost of Capital (WACC) Estimates for PCP and BRK BRK view Source PCP view Components Cost of Equity 10 Footnote 6 and 15 Footnote 15 Market Return Market Roisk Premium Cost of equity capital Calculate 12 13 14 15 16 MRP Market return -Risk-ree rate Footnote 15 Calculate Cost of equity capital Risk-tree rate(Beta MRP Cost of Debt Footnote 15 Footnote 15 Caculate A-rated corporate bond yield Maignal tax me Ater tax cost of debe 19 Atee4ax cost of debt . Pre-tax cost of debt-11-Margnal tax rat 21 n mtions of doliars) Long-term debt as of 810/ MV of equty (pre-announce) Enterpise vaue (pre-anounce) Footnote 1 CakculateEnterprise value (EV)value of long-term debt + MV of equiy Calculate for PCP gnern Footnote 15 for BRK % Debt . Long-term debt/Total NA AFootnote to Exhib9 29 30 %Debt %Equity %Eqty . MV of equity Total Ey Calculate for PCP g ven in Footnote 15 for BRK Close s ype here to search 3. * Use Exhibit 12 to calculate the weighted average cost of capital (WACC) for both BRK and PCP. Follow the prompts to locate the inputs in the case and perform the calculations. On the surface, which cost of capital is the appropriate hurdle rate to evaluate BRK's investment in PCP? Why? NOP Exhibit 12 Weighted Average Cost of Capital (WACC) Estimates for PCP and BRK Components PCP view BRK view Source Calculation Cost of Equity 10 Market Return Risk-free rate Market Risk Premium Beta Cost of equity capital Footnote 6 and 1 12 13 ootnote 15 Calculate Footnote 15 Calculate MRP Market return-Risk-free rate Cost of equity capital Risk-free rate(Beta x MRP) 15 16 17 18 19 20 21 Cost of Debr AA-rated corporate bond yield Marginal tax rate After-tax cost of debt Footnote 15 Footnote 15 Calculate After-tax cost of debt Pre-tax cost of debtx(1-Marginal tax rate) 23 24 25 26 27 28 29 30 31 Component Weights In millions of dollars) ong-term debt as of 8/10/15 MV of equity (pre-announce) Enterprise value (pre-announce) Footnote 1 Footnote to Exh bit CalculateEnterprise value (EV) value of long-term debt MV of equity NA NA % Debts Long-term debt/Total EV % Equity = MV of equity/Total EV Calculate for PCP, given in Footnote 15 for BRK Calculate for PCP, given in Footnote 15 for BRK % Debt % Equity 32 WACCH%DettrMer tax cost of debt-(% Equity x cost or equity) calculate Weighted average cost of capital Exh 3-XExh 4 Exh S Exh 9 Exh 10 Exh 11 Exh 12 Exh 1 :. 1224 PM 5/13/2019 39 40 Miscellaneous information for reality check (in millions)-- # shares ve Exhibit 10 Footnote 5 Footnote 5 Paragraph 1 Paragraph 1 Paragraph 1 Market price 8/7/15 Market price 8/1015 BRK bid price Equity value of deal Total EV of deal 42 43 46 49 50 52 53 56 57 58 59 60 61 62 63 64 65 tia Review View Help Search PROTECTED VIEW Be ca Share -files from the I ncan condain viues Unless you need to edit, it's safer to stay in Protected Vew Enable Edding Exhibit 10 Warren E. Bufflett, 2015 Comparable Firms Div Per TotalTotal Compamy Shares oys Low Hich Debe Rew NIDA ENI Net 2167 $15.77 $16 03 0 12 $37,399 $22,605 $1,877 $83 $8,769 $6.975 $23.906 $3556 $2,185 $2043 $677 $111 $46 S246 S181 $1.307 %193 s131 sal 5659 $20 64 $20 85 50 11 $41547 $3.348 $4 122 $1071 6651 $3,600 41304 $220 $1,314 $210 108 7 $3459 $3541 072 3$3361 $270 $18 $1.509 125 422 523 108. 631 56175 563 35 072 53058 51.053$120o 04 484 $2.173 $382 $212 $133 418 $209 61 $21136 $0.12 $19 428 $8,471 474 $1,093 $3493 4 112 $10.005 $2.927 $2.602 $1.530 Share Assets lEqui 40 $21.30 2150 037 $1,387 O Thyssenkrupp 1 Allesheny Technologies 2 Carpenter Technology 3 Predision Castparts1 Note Dollar values are in millions except for share prices aed dividends per share, which "re in dollar units sares outstanding losi are stated in millions Alcoa, inc,engages in lightweight metals engineering and manufacturing its groducts are used woldde iircraft, automabiles, commercial transpertation, packaging eil and gas, defense, and induutrial apelications 7 lus, sengnges in manufacturing of multifunctional "asteners and assembly compoerts fothree bains sectors Aerospace-me-and Med-al a Thyssenkrupo AG engsges in the production of steel. The Components Technoloy business area offlers components for the ausmotive, construction, and engineering sectors O Carpenter Technology Corp engages in drveloome. mar facture and d strib nangcas' wo M a d po der metal stainless steel. Itierates through Specialty Ali0ys .ation.. d Peder-e ce t e een.ourts see en. 2Data sources Company reports, Factset Allerhe y Tech engages in the manufac s re o, senialty material, and components fo' dimerent industries which-ul de aerospace and delense, ol 'ed en and che o ogies, inc cal processingS-l ai-ti-l en 1228 PM O Type here to search Exhibit 9 Warren E, Buftett, 2015 PCP Consolidated Financial Statements 6 Income Statement IIn millions, except per share data, unless otherwise specified) 12 months ending March 31 20132014 2015 $8,347$9,533$10,005 9 Revenue 10 Operating expenses 11 Income from operations 12 Net interest expense 13 Income before income tax expense 14 Income tax expense 15 Consolidated net income from continuing operations 2,612 7165 2,547 2,159 2,659 2,128 $1,43351175851.761 17 Balance Sheet 12 months ending March 31 (in mvillions, except per share data, unless otherwise 19 Assets: 20 Current assets 21 Net property, plant and equipment 22 Other assets 23 Total assets 24 $5,972 2,300 $18,586$19,428 25 Llabities & Shareholder Equity 26 Current liabilities 27 Long-term deblt 28 Pension obligation 29 Other long-term liabilities 30 Total liabilities 31 Shareholders' equity 32Total iabilities and stockholders' equity $1,608 $2,827 1,43 8471 11,413 4 "Note Fiscal year ends March 31. Period listed as 2015 reprevents March 31,2014, to March 31, 2015 12 months ending March Depreciation& amortiuzation $325 al expenditures 1 Net working capital 53,368 1,145 $1,89 tiients would be llI Competitive, and that even then the financial returns ern comparison, the annual average total return on all large stocks from 1965 to the end of 2014 was 99%. (See Warren Buffett, annual letter to shareholders, 2014.) 'Warren Buffett, annual letter to shareholders, 2001 . Warren Buffett has since pledged to donate 99% of his net worth to philanthropic foundations. See http://givingpledge.org. lucu Tisk, and therefore should use a risk-free Berkshire Hathaway Inc. annual report, 2004. "Berkshire Hathaway's cost of equity was 9.2%, which reflected a beta of 0.90, an expected market return of 9.90%, and a risk-free rate of 2.89%. The yield on corporate bonds rated AA was 3.95%-and after a 39% expected marginal tax rate, the cost of debt would be 2.3%. weights of capital were 16.9% for debt and 83.1% for equity. In contrast, the beta for PCP was 0.38. Analysts expected that PCP's cash flows would grow indefinitely at about the long-term expected real growth rate of the US, economy, 2.5%. 12 Months Ending March 31 th mmions, except per share data, uness oftherwise specified) 9533 6,874 2.659 10.00 6.188 2.159 2812 income from operations Net interest expense 2.588 830 2547 816 2.128 income before income tax expense Income tax e 1,433 net income from continuing operations 2014 2013 2012 2011 Balance Sheet in millions, except per share data, unless otherwise specified) Assets: $ 5.972 2,474 10,982 $ 5,507 Current assets Net property. plant, and equipment Other assets Total assets 2,300 10,779 $18,586 $18.586 $1922 Liabilities & Shareholder Equity: $ 2.827 $ 1,608 Current Ilabilities Long-term debt Pension obligation Other long-term iabilities Total liabilities Shareholders' equity Total liabilities and stockholders' equity 3.569 442 3,493 678 473 8471 10,957 $19.428 1,554 7.173 11.413 $18,586 Note-Fiscal year ends March 31. Period isted as 2015 represents March 31, 2014 to March 31,2015 Note: The market value of PCP's equity shortly before the announcement of the acquisition by Berkshire Hathaway was $31.208 mition. Data source: Edgar. Excludes restructuring charges Excludes equity in unconsolidated investments. Excludes noncontroling interests
Step by Step Solution
There are 3 Steps involved in it

Get step-by-step solutions from verified subject matter experts