

Question: for 2 c. sample size is (n = 50 ) 2c. Draw the control chart for the following data which happens to be the weights
for 2 c.
sample size is (n = 50 )
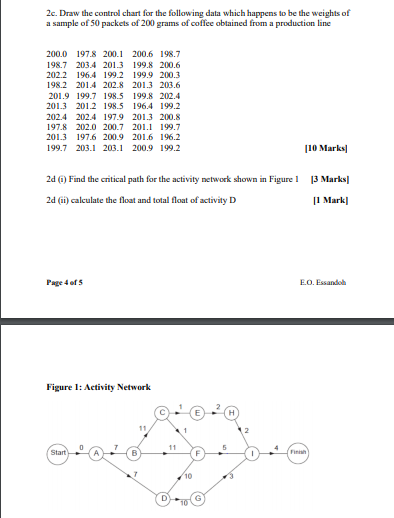
2c. Draw the control chart for the following data which happens to be the weights of a sample of 50 packets of 200 grams of coffee obtained from a production line 200.0 197.8 200.1 200.6 198.7 198.7 203.4 201.3 199.8 200.6 202.2 196.4 1992 199.9 200.3 198.2 201.4 202.8 201.3 203.6 201.9 199.7 198.5 199.8 202.4 2013 2012 198.5 196.4 199.2 2024 202.4 1979 201.3 200.8 197.8 202.0 200.7 201.1 199.7 201.3 197.6 200.9 201.6 196.2 199.7 203.1 203.1 200.9 199.2 110 Marks 2) Find the critical path for the activity network shown in Figure 13 Marks | 2 (ii) calculate the float and total float of activity D [1 Mark! Page 4 of s E.O. Essandoh Figure 1: Activity Network 11 Start B F 10 DStep by Step Solution
There are 3 Steps involved in it
1 Expert Approved Answer
Step: 1 Unlock

Question Has Been Solved by an Expert!
Get step-by-step solutions from verified subject matter experts
Step: 2 Unlock
Step: 3 Unlock