

Question: for A , B , and C : The correlation coefficients for each pair are shown in the following matrix, with each cell in the
for and :
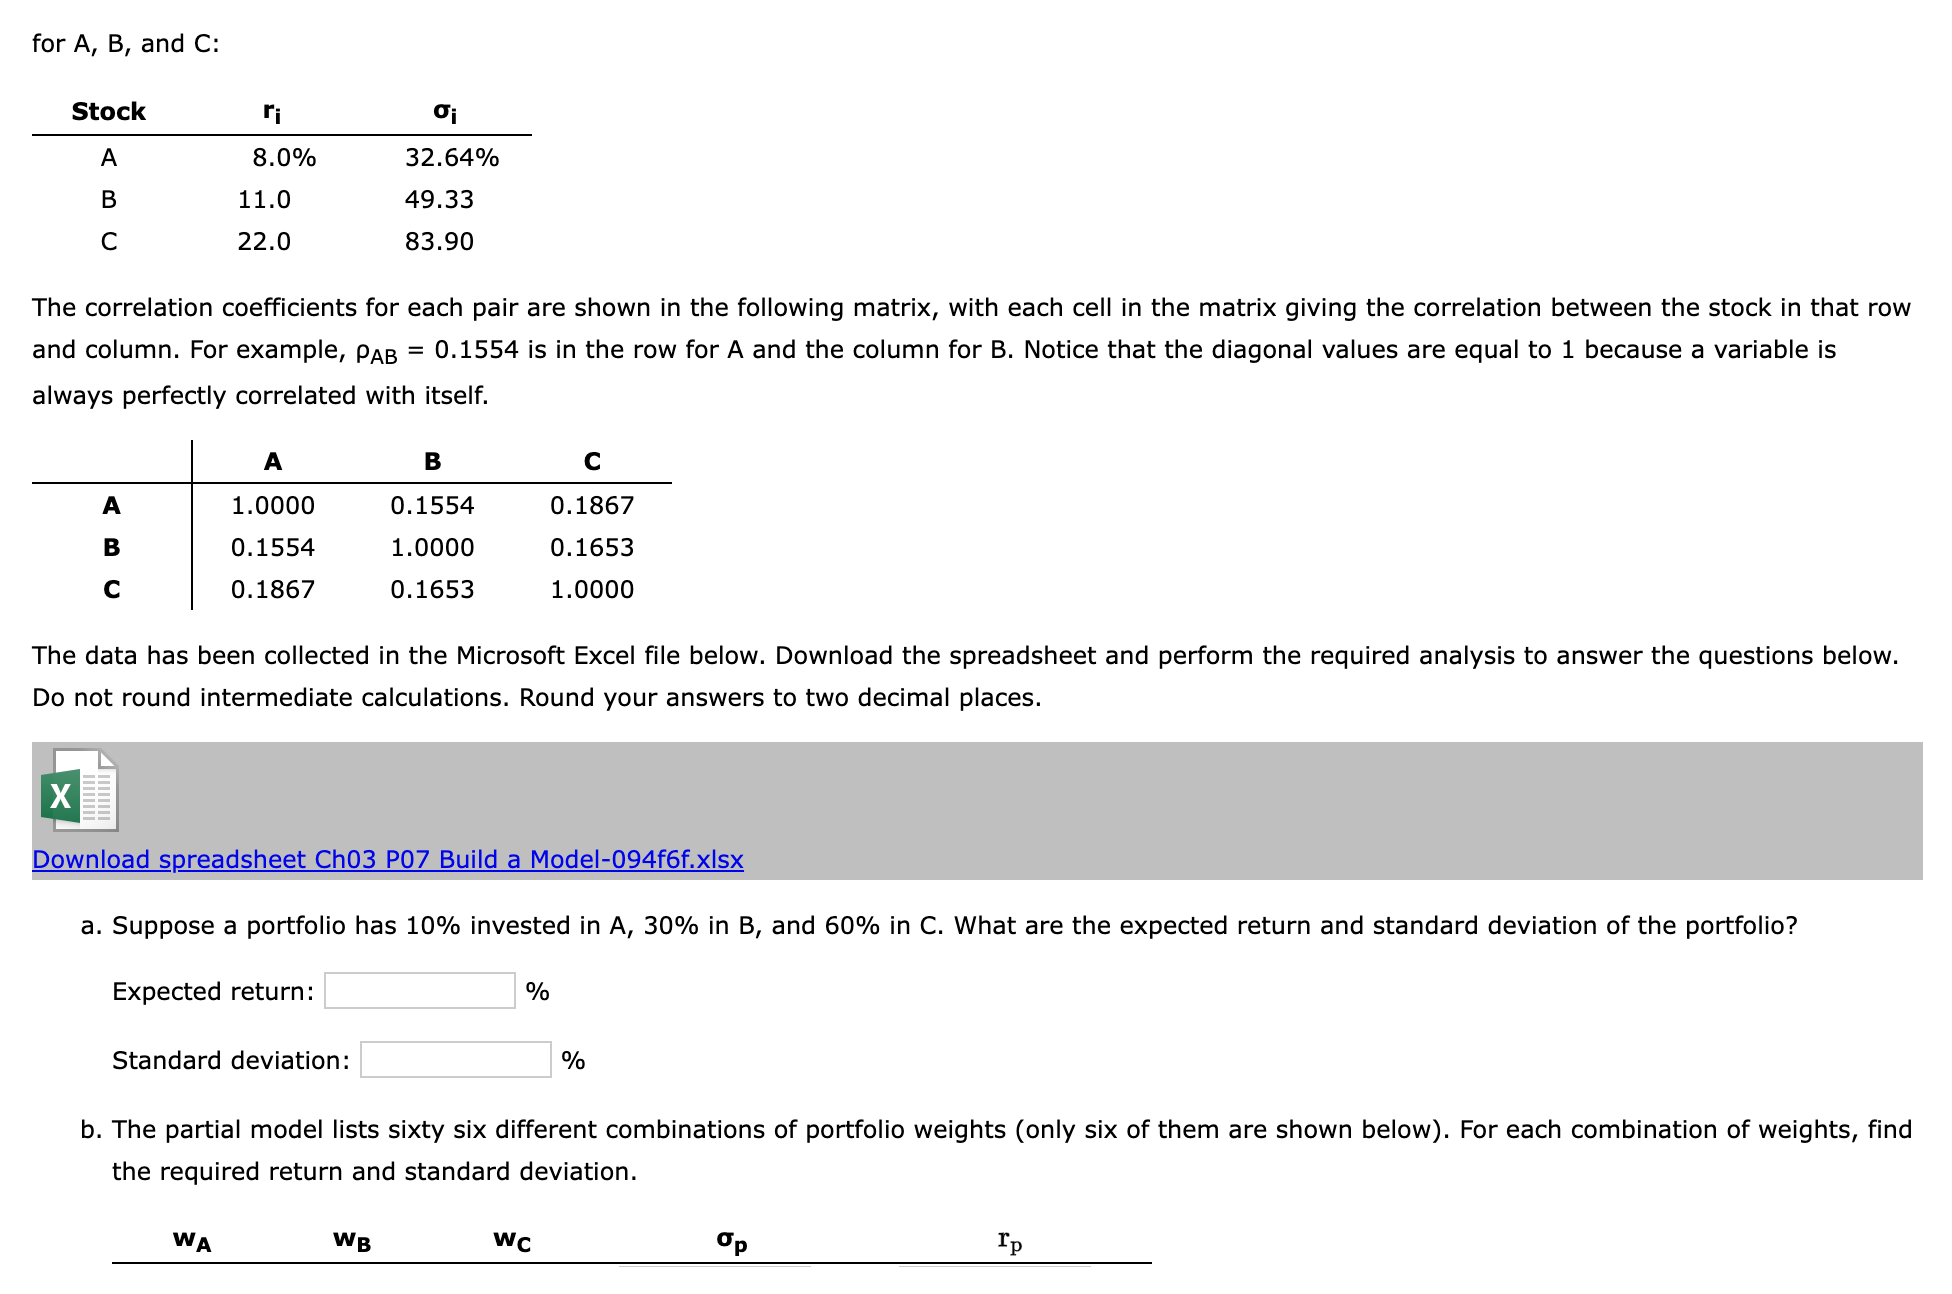
The correlation coefficients for each pair are shown in the following matrix, with each cell in the matrix giving the correlation between the stock in that row
and column. For example, is in the row for A and the column for Notice that the diagonal values are equal to because a variable is
always perfectly correlated with itself.
The data has been collected in the Microsoft Excel file below. Download the spreadsheet and perform the required analysis to answer the questions below.
Do not round intermediate calculations. Round your answers to two decimal places.
Download spreadsheet Ch P Build a ModelffxIsx
a Suppose a portfolio has invested in A in B and in What are the expected return and standard deviation of the portfolio?
Expected return:
Standard deviation:
b The partial model lists sixty six different combinations of portfolio weights only six of them are shown below For each combination of weights, find
the required return and standard deviation.
Step by Step Solution
There are 3 Steps involved in it
1 Expert Approved Answer
Step: 1 Unlock

Question Has Been Solved by an Expert!
Get step-by-step solutions from verified subject matter experts
Step: 2 Unlock
Step: 3 Unlock