Question: For a trip over spring break in a recent year, the data below (obtained from a travel website) show the price per night (in dollars)
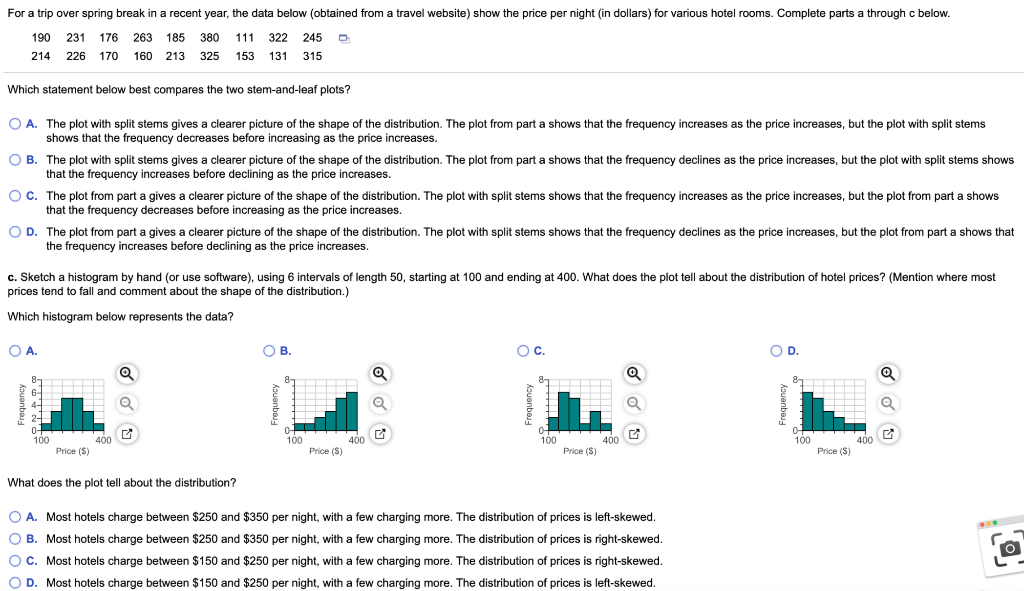
For a trip over spring break in a recent year, the data below (obtained from a travel website) show the price per night (in dollars) for various hotel rooms. Complete parts a through c below. 190 231 176 263 185 380 111 322 245 214 226 170 160 213 325 153 131 315 Which statement below best compares the two stem-and-leaf plots? O A. The plot with split stems gives a clearer picture of the shape of the distribution. The plot from part a shows that the frequency increases as the price increases, but the plot with split stems shows that the frequency decreases before increasing as the price increases. OB. The plot with split stems gives a clearer picture of the shape of the distribution. The plot from part a shows that the frequency declines as the price increases, but the plot with split stems shows that the frequency increases before declining as the price increases. OC. The plot from part a gives a clearer picture of the shape of the distribution. The plot with split stems shows that the frequency increases as the price increases, but the plot from part a shows that the frequency decreases before increasing as the price increases. OD. The plot from part a gives a clearer picture of the shape of the distribution. The plot with split stems shows that the frequency declines as the price increases, but the plot from part a shows that the frequency increases before declining as the price increases. c. Sketch a histogram by hand (or use software), using 6 intervals of length 50, starting at 100 and ending at 400. What does the plot tell about the distribution of hotel prices? (Mention where most prices tend to fall and comment about the shape of the distribution.) Which histogram below represents the data? . Oc. OD Q 8 8- Frequency Q Frequency Frequency Q Louane 0- 0- 100 100 400 400 0- 100 400 100 400 Price ($) Price (S) Price (S) Price ($) What does the plot tell about the distribution? O A. Most hotels charge between $250 and $350 per night, with a few charging more. The distribution of prices is left-skewed. OB. Most hotels charge between $250 and $350 per night, with a few charging more. The distribution of prices is right-skewed. OC. Most hotels charge between $150 and $250 per night, with a few charging more. The distribution of prices is right-skewed. OD. Most hotels charge between $150 and $250 per night, with a few charging more. The distribution of prices is left-skewed. For a trip over spring break in a recent year, the data below (obtained from a travel website) show the price per night (in dollars) for various hotel rooms. Complete parts a through c below. 190 231 176 263 185 380 111 322 245 214 226 170 160 213 325 153 131 315 Which statement below best compares the two stem-and-leaf plots? O A. The plot with split stems gives a clearer picture of the shape of the distribution. The plot from part a shows that the frequency increases as the price increases, but the plot with split stems shows that the frequency decreases before increasing as the price increases. OB. The plot with split stems gives a clearer picture of the shape of the distribution. The plot from part a shows that the frequency declines as the price increases, but the plot with split stems shows that the frequency increases before declining as the price increases. OC. The plot from part a gives a clearer picture of the shape of the distribution. The plot with split stems shows that the frequency increases as the price increases, but the plot from part a shows that the frequency decreases before increasing as the price increases. OD. The plot from part a gives a clearer picture of the shape of the distribution. The plot with split stems shows that the frequency declines as the price increases, but the plot from part a shows that the frequency increases before declining as the price increases. c. Sketch a histogram by hand (or use software), using 6 intervals of length 50, starting at 100 and ending at 400. What does the plot tell about the distribution of hotel prices? (Mention where most prices tend to fall and comment about the shape of the distribution.) Which histogram below represents the data? . Oc. OD Q 8 8- Frequency Q Frequency Frequency Q Louane 0- 0- 100 100 400 400 0- 100 400 100 400 Price ($) Price (S) Price (S) Price ($) What does the plot tell about the distribution? O A. Most hotels charge between $250 and $350 per night, with a few charging more. The distribution of prices is left-skewed. OB. Most hotels charge between $250 and $350 per night, with a few charging more. The distribution of prices is right-skewed. OC. Most hotels charge between $150 and $250 per night, with a few charging more. The distribution of prices is right-skewed. OD. Most hotels charge between $150 and $250 per night, with a few charging more. The distribution of prices is left-skewed


