

Question: for any calculation please use an excel formula and for questions 8 and 9 only calculate the expected returns. please show work as well Portfolio
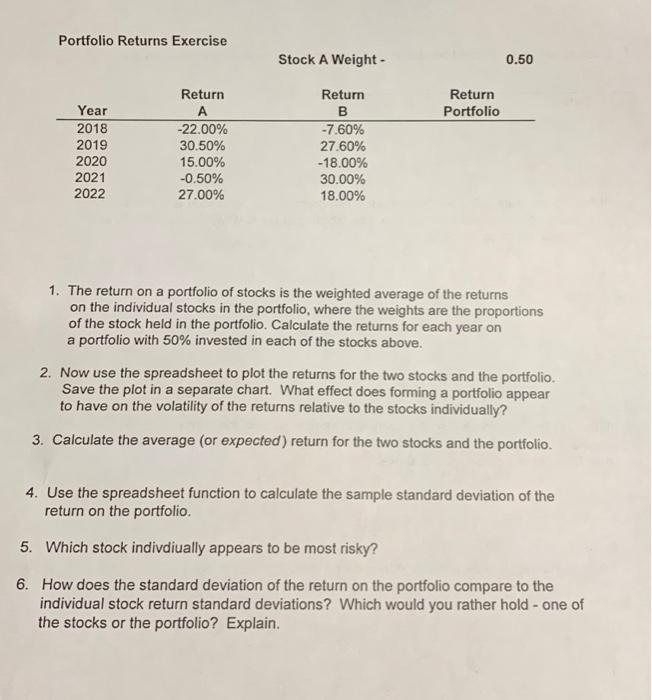
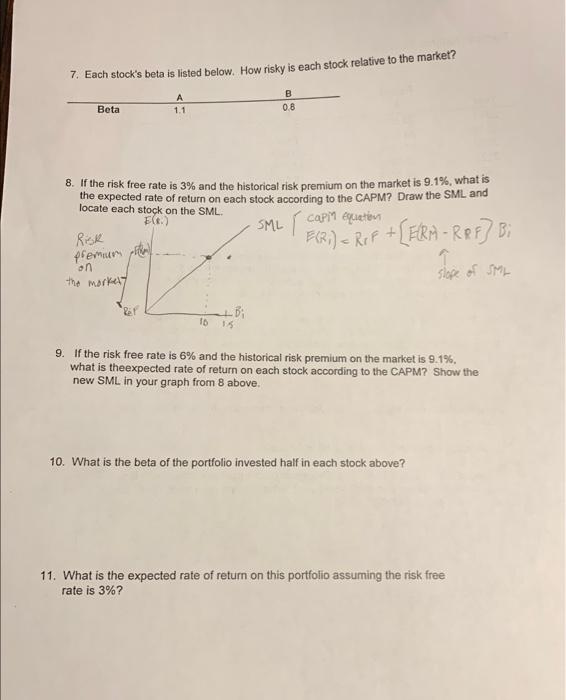
Portfolio Returns Exercise Stock A Weight - 0.50 1. The return on a portfolio of stocks is the weighted average of the returns on the individual stocks in the portfolio, where the weights are the proportions of the stock held in the portfolio. Calculate the returns for each year on a portfolio with 50% invested in each of the stocks above. 2. Now use the spreadsheet to plot the returns for the two stocks and the portfolio. Save the plot in a separate chart. What effect does forming a portfolio appear to have on the volatility of the returns relative to the stocks individually? 3. Calculate the average (or expected) return for the two stocks and the portfolio. 4. Use the spreadsheet function to calculate the sample standard deviation of the return on the portfolio. 5. Which stock indivdiually appears to be most risky? 6. How does the standard deviation of the return on the portfolio compare to the individual stock return standard deviations? Which would you rather hold - one of the stocks or the portfolio? Explain. 7. Each stock's beta is listed below. How risky is each stock relative to the market? 8. If the risk free rate is 3% and the historical risk premium on the market is 9.1%, what is the expected rate of return on each stock according to the CAPM? Draw the SML and locate each stock on tha SMit 9. If the risk free rate is 6% and the historical risk premium on the market is 9.1%. What is theexpected rate of return on each stock according to the CAPM? Show the new SML in your graph from 8 above. 10. What is the beta of the portfolio invested half in each stock above? 11. What is the expected rate of return on this portfolio assuming the risk free rate is 3% ? Portfolio Returns Exercise Stock A Weight - 0.50 1. The return on a portfolio of stocks is the weighted average of the returns on the individual stocks in the portfolio, where the weights are the proportions of the stock held in the portfolio. Calculate the returns for each year on a portfolio with 50% invested in each of the stocks above. 2. Now use the spreadsheet to plot the returns for the two stocks and the portfolio. Save the plot in a separate chart. What effect does forming a portfolio appear to have on the volatility of the returns relative to the stocks individually? 3. Calculate the average (or expected) return for the two stocks and the portfolio. 4. Use the spreadsheet function to calculate the sample standard deviation of the return on the portfolio. 5. Which stock indivdiually appears to be most risky? 6. How does the standard deviation of the return on the portfolio compare to the individual stock return standard deviations? Which would you rather hold - one of the stocks or the portfolio? Explain. 7. Each stock's beta is listed below. How risky is each stock relative to the market? 8. If the risk free rate is 3% and the historical risk premium on the market is 9.1%, what is the expected rate of return on each stock according to the CAPM? Draw the SML and locate each stock on tha SMit 9. If the risk free rate is 6% and the historical risk premium on the market is 9.1%. What is theexpected rate of return on each stock according to the CAPM? Show the new SML in your graph from 8 above. 10. What is the beta of the portfolio invested half in each stock above? 11. What is the expected rate of return on this portfolio assuming the risk free rate is 3%
Step by Step Solution
There are 3 Steps involved in it

Get step-by-step solutions from verified subject matter experts