

Question: For below given P b - B i binary phase diagram; a ) Schematically plot the variation of Gibbs free energy vs . composition 2
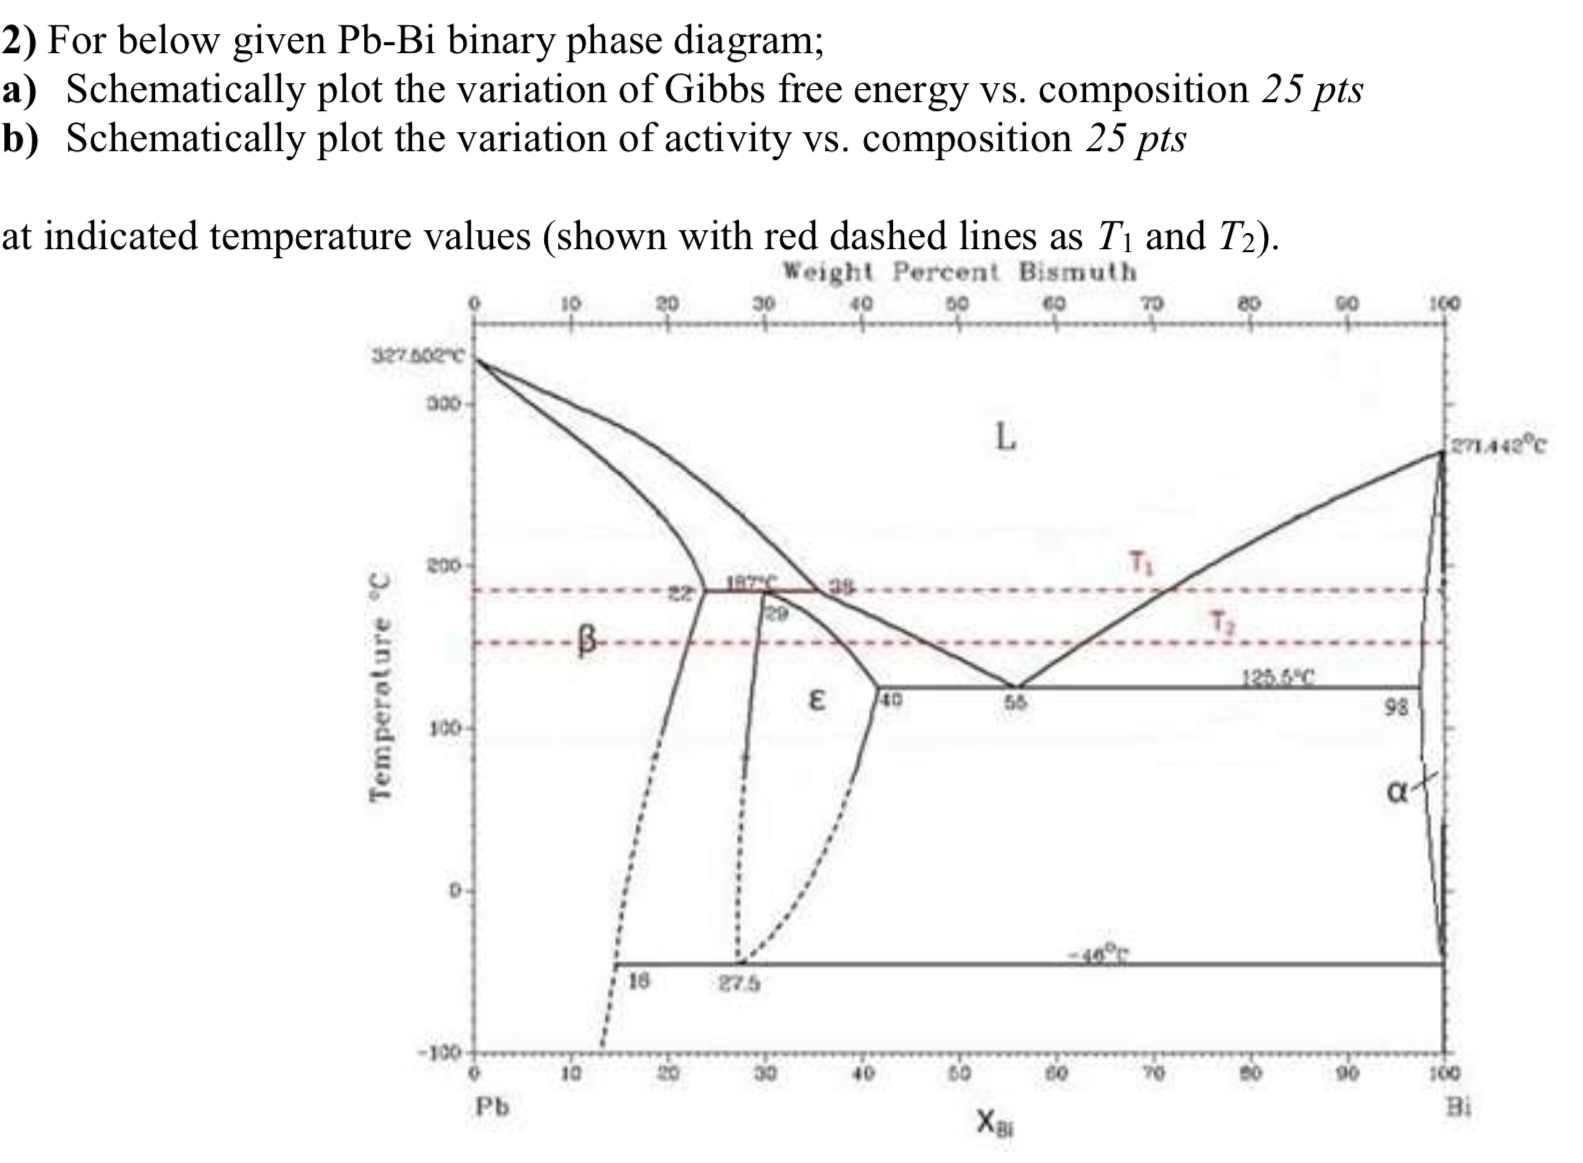
For below given binary phase diagram;
a Schematically plot the variation of Gibbs free energy vs composition
b Schematically plot the variation of activity vs composition
at indicated temperature values shown with red dashed lines as and
Weight Percent Bismuth
Step by Step Solution
There are 3 Steps involved in it
1 Expert Approved Answer
Step: 1 Unlock

Question Has Been Solved by an Expert!
Get step-by-step solutions from verified subject matter experts
Step: 2 Unlock
Step: 3 Unlock