

Question: For e) and d) how did I find Z using the alpha risk?? and vice versa??? c) What is your estimate of the mean and
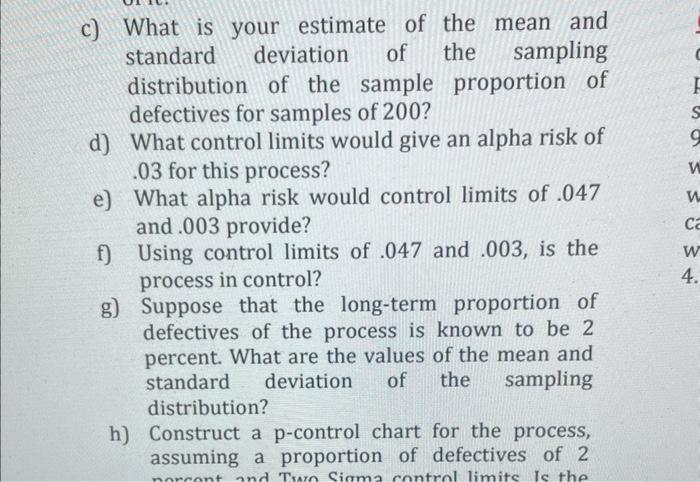
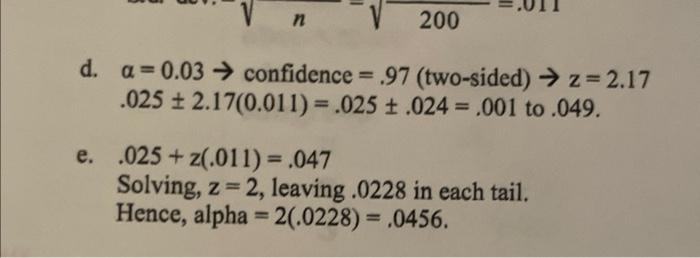
c) What is your estimate of the mean and standard deviation of the sampling distribution of the sample proportion of defectives for samples of 200 ? d) What control limits would give an alpha risk of .03 for this process? e) What alpha risk would control limits of .047 and .003 provide? f) Using control limits of .047 and .003 , is the process in control? g) Suppose that the long-term proportion of defectives of the process is known to be 2 percent. What are the values of the mean and standard deviation of the sampling distribution? h) Construct a p-control chart for the process, assuming a proportion of defectives of 2 d. =0.03 confidence =.97 (two-sided) z=2.17 .0252.17(0.011)=.025.024=.001 to .049 . e. .025+z(.011)=.047 Solving, z=2, leaving .0228 in each tail. Hence, alpha =2(.0228)=.0456
Step by Step Solution
There are 3 Steps involved in it

Get step-by-step solutions from verified subject matter experts