

Question: For E) For portfolio AB, both risk and return are (higher/lower) than for stock A alone. The CV of the portfolio is (more/less) than that
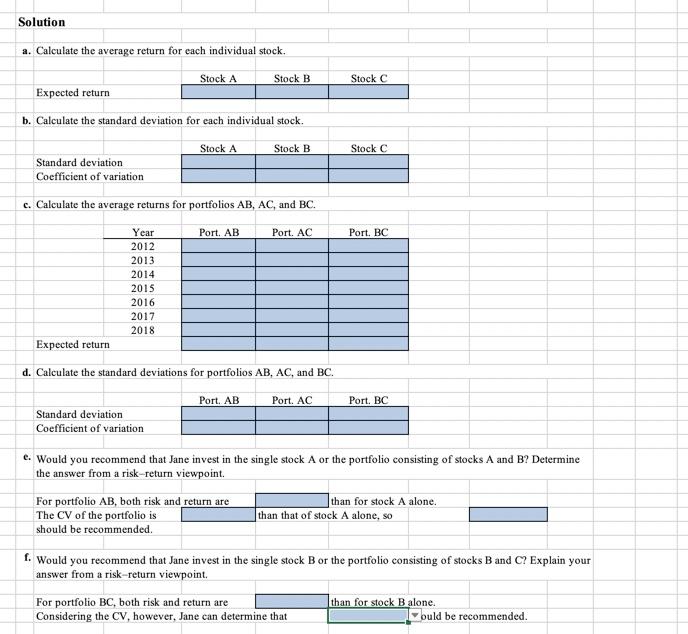
For E) For portfolio AB, both risk and return are (higher/lower) than for stock A alone. The CV of the portfolio is (more/less) than that of stock A alone, so (stock A, portfolio AB) should be recommended.
For F) For portfolio BC, both risk and return are (higher/lower) than for stock B alone. Considering the CV, however, Jane can determine that (stock B, portfolio BC) should be recommended.
I need so much help filling everything out in the blue blanks, thanks for your assistance, I... am.... lost.
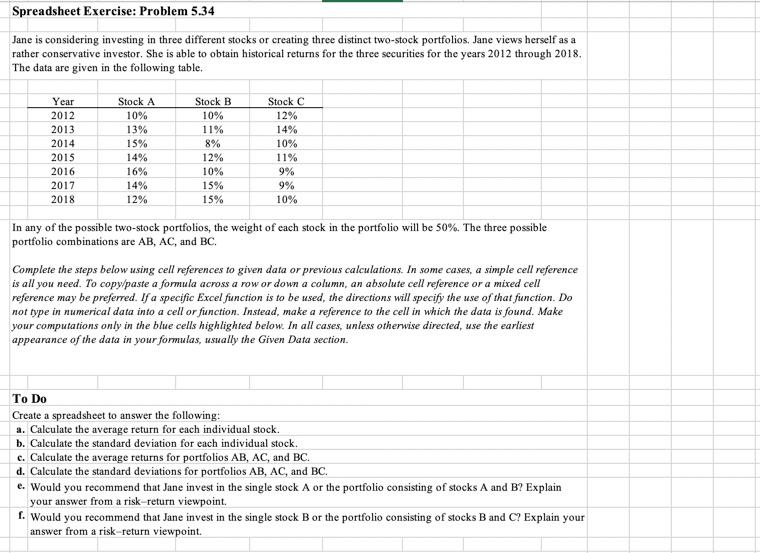
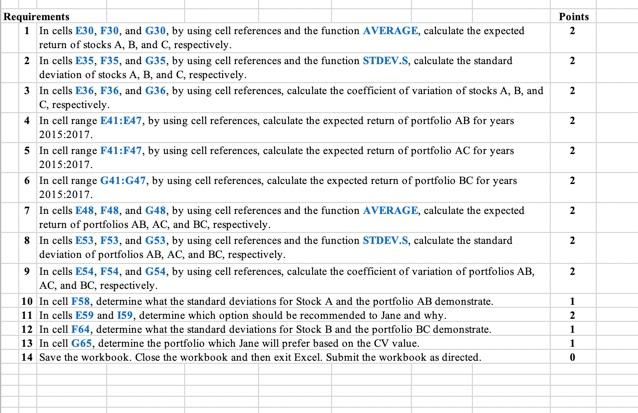
Spreadsheet Exercise: Problem 5.34 Jane is considering investing in three different stocks or creating three distinct two-stock portfolios, Jane views herself as a rather conservative investor. She is able to obtain historical returns for the three securities for the years 2012 through 2018, The data are given in the following table, Year 2012 2013 2014 2015 2016 2017 2018 Stock A 10% 13% 15% 14% 16% 14% 12% Stock B 10% 11% 8% 12% 10% 15% 15% Stock C 12% 14% 10% 11% 9% 9% 10% In any of the possible two-stock portfolios, the weight of each stock in the portfolio will be 50%. The three possible portfolio combinations are AB, AC, and BC. Complete the steps below using cell references to given data or previous calculations. In some cases, a simple cell reference is all you need. To copy/paste a formula across a row or down a column, an absolute cell reference or a mixed cell reference may be preferred. If a specific Excel function is to be used, the directions will specify the use of that function. Do not type in numerical data into a cell or function. Instead, make a reference to the cell in which the data is found. Make your computations only in the blue cells highlighted below. In all cases, unless otherwise directed, use the earliest appearance of the data in your formulas, usually the Given Data section. To Do Create a spreadsheet to answer the following: a. Calculate the average return for each individual stock. b. Calculate the standard deviation for each individual stock. c. Calculate the average returns for portfolios AB, AC, and BC. d. Calculate the standard deviations for portfolios AB, AC, and BC. e. Would you recommend that Jane invest in the single stock A or the portfolio consisting of stocks A and B? Explain your answer from a risk-return viewpoint. f. Would you recommend that Jane invest in the single stock B or the portfolio consisting of stocks B and C? Explain your answer from a risk-return viewpoint. Solution a. Calculate the average return for each individual stock. Stock B Stock C Stock A Expected return b. Calculate the standard deviation for each individual stock. Stock A Stock B Stock C Standard deviation Coefficient of variation c. Calculate the average returns for portfolios AB, AC, and BC. Port AB Port. AC Port, BC Year 2012 2013 2014 2015 2016 2017 2018 Expected return d. Calculate the standard deviations for portfolios AB, AC, and BC. Port AB Port. AC Port BC Standard deviation Coefficient of variation e. Would you recommend that Jane invest in the single stock A or the portfolio consisting of stocks A and B? Determine the answer from a risk-return viewpoint. For portfolio AB, both risk and return are The CV of the portfolio is should be recommended than for stock A alone. than that of stock A alone, so f. Would you recommend that Jane invest in the single stock B or the portfolio consisting of stocks B and C? Explain your answer from a risk-return viewpoint. For portfolio BC, both risk and return are than for stock B alone. Considering the CV, however, Jane can determine that ould be recommended Points 2 2 2 2 2 2 Requirements 1 In cells E30, F30, and G30, by using cell references and the function AVERAGE, calculate the expected return of stocks A, B, and C, respectively, 2 In cells E35, F35, and G35, by using cell references and the function STDEV.S, calculate the standard deviation of stocks A, B, and C, respectively, 3 In cells E36, F36, and G36, by using cell references, calculate the coefficient of variation of stocks A, B, and C, respectively. 4 In cell range E41:E47, by using cell references, calculate the expected return of portfolio AB for years 2015:2017 5 In cell range F41:F47, by using cell references, calculate the expected return of portfolio AC for years 2015:2017. 6 In cell range G41:G47, by using cell references, calculate the expected return of portfolio BC for years 2015:2017 7 In cells E48, F48, and G48, by using cell references and the function AVERAGE, calculate the expected return of portfolios AB, AC, and BC, respectively. 8 In cells ES3, F53, and G53, by using cell references and the function STDEV.S, calculate the standard deviation of portfolios AB, AC, and BC, respectively. 9 In cells E54, F54, and G54, by using cell references, calculate the coefficient of variation of portfolios AB, AC, and BC, respectively. 10 In cell F58, determine what the standard deviations for Stock A and the portfolio AB demonstrate. 11 In cells E59 and 159, determine which option should be recommended to Jane and why. 12 In cell F64, determine what the standard deviations for Stock B and the portfolio BC demonstrate. 13 In cell G65, determine the portfolio which Jane will prefer based on the CV value. 14 Save the workbook. Close the workbook and then exit Excel. Submit the workbook as directed. 2 2 2 1 2 1 1 0 Spreadsheet Exercise: Problem 5.34 Jane is considering investing in three different stocks or creating three distinct two-stock portfolios, Jane views herself as a rather conservative investor. She is able to obtain historical returns for the three securities for the years 2012 through 2018, The data are given in the following table, Year 2012 2013 2014 2015 2016 2017 2018 Stock A 10% 13% 15% 14% 16% 14% 12% Stock B 10% 11% 8% 12% 10% 15% 15% Stock C 12% 14% 10% 11% 9% 9% 10% In any of the possible two-stock portfolios, the weight of each stock in the portfolio will be 50%. The three possible portfolio combinations are AB, AC, and BC. Complete the steps below using cell references to given data or previous calculations. In some cases, a simple cell reference is all you need. To copy/paste a formula across a row or down a column, an absolute cell reference or a mixed cell reference may be preferred. If a specific Excel function is to be used, the directions will specify the use of that function. Do not type in numerical data into a cell or function. Instead, make a reference to the cell in which the data is found. Make your computations only in the blue cells highlighted below. In all cases, unless otherwise directed, use the earliest appearance of the data in your formulas, usually the Given Data section. To Do Create a spreadsheet to answer the following: a. Calculate the average return for each individual stock. b. Calculate the standard deviation for each individual stock. c. Calculate the average returns for portfolios AB, AC, and BC. d. Calculate the standard deviations for portfolios AB, AC, and BC. e. Would you recommend that Jane invest in the single stock A or the portfolio consisting of stocks A and B? Explain your answer from a risk-return viewpoint. f. Would you recommend that Jane invest in the single stock B or the portfolio consisting of stocks B and C? Explain your answer from a risk-return viewpoint. Solution a. Calculate the average return for each individual stock. Stock B Stock C Stock A Expected return b. Calculate the standard deviation for each individual stock. Stock A Stock B Stock C Standard deviation Coefficient of variation c. Calculate the average returns for portfolios AB, AC, and BC. Port AB Port. AC Port, BC Year 2012 2013 2014 2015 2016 2017 2018 Expected return d. Calculate the standard deviations for portfolios AB, AC, and BC. Port AB Port. AC Port BC Standard deviation Coefficient of variation e. Would you recommend that Jane invest in the single stock A or the portfolio consisting of stocks A and B? Determine the answer from a risk-return viewpoint. For portfolio AB, both risk and return are The CV of the portfolio is should be recommended than for stock A alone. than that of stock A alone, so f. Would you recommend that Jane invest in the single stock B or the portfolio consisting of stocks B and C? Explain your answer from a risk-return viewpoint. For portfolio BC, both risk and return are than for stock B alone. Considering the CV, however, Jane can determine that ould be recommended Points 2 2 2 2 2 2 Requirements 1 In cells E30, F30, and G30, by using cell references and the function AVERAGE, calculate the expected return of stocks A, B, and C, respectively, 2 In cells E35, F35, and G35, by using cell references and the function STDEV.S, calculate the standard deviation of stocks A, B, and C, respectively, 3 In cells E36, F36, and G36, by using cell references, calculate the coefficient of variation of stocks A, B, and C, respectively. 4 In cell range E41:E47, by using cell references, calculate the expected return of portfolio AB for years 2015:2017 5 In cell range F41:F47, by using cell references, calculate the expected return of portfolio AC for years 2015:2017. 6 In cell range G41:G47, by using cell references, calculate the expected return of portfolio BC for years 2015:2017 7 In cells E48, F48, and G48, by using cell references and the function AVERAGE, calculate the expected return of portfolios AB, AC, and BC, respectively. 8 In cells ES3, F53, and G53, by using cell references and the function STDEV.S, calculate the standard deviation of portfolios AB, AC, and BC, respectively. 9 In cells E54, F54, and G54, by using cell references, calculate the coefficient of variation of portfolios AB, AC, and BC, respectively. 10 In cell F58, determine what the standard deviations for Stock A and the portfolio AB demonstrate. 11 In cells E59 and 159, determine which option should be recommended to Jane and why. 12 In cell F64, determine what the standard deviations for Stock B and the portfolio BC demonstrate. 13 In cell G65, determine the portfolio which Jane will prefer based on the CV value. 14 Save the workbook. Close the workbook and then exit Excel. Submit the workbook as directed. 2 2 2 1 2 1 1 0
Step by Step Solution
There are 3 Steps involved in it

Get step-by-step solutions from verified subject matter experts