

Question: a Share Commer El Fee Edit View Insert Format Tools Data Window Help . Reinheimer Zutter Spreadsheet Chapter 8 Start Home Insert Draw Page Layout
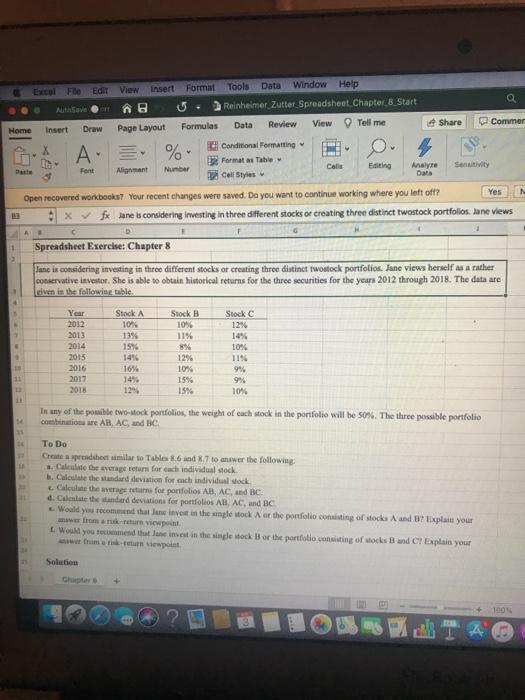
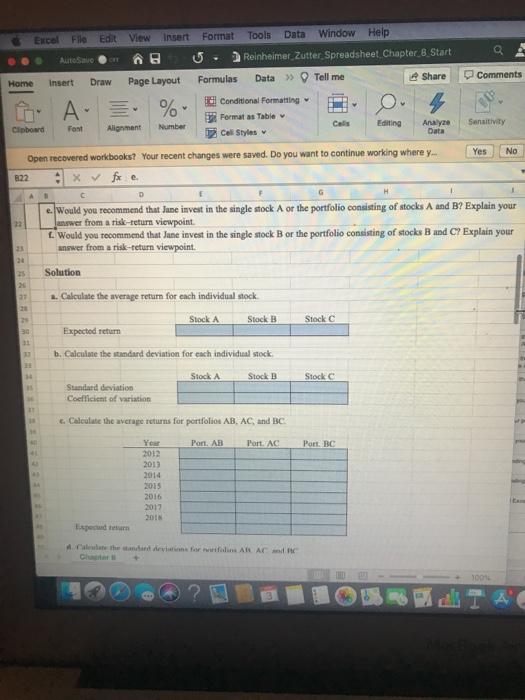
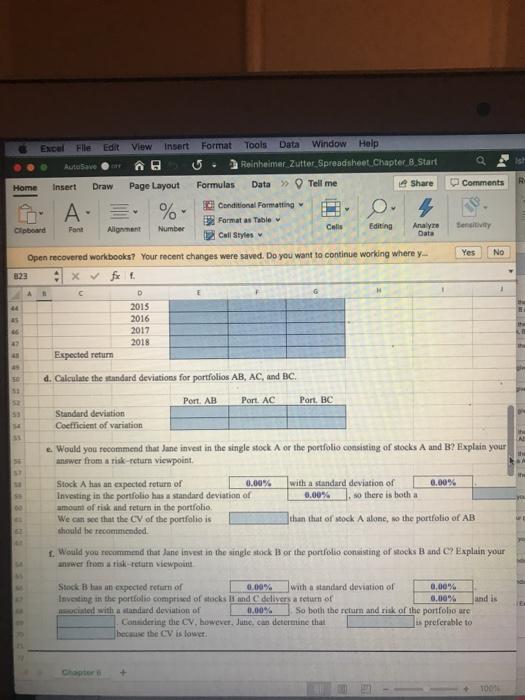
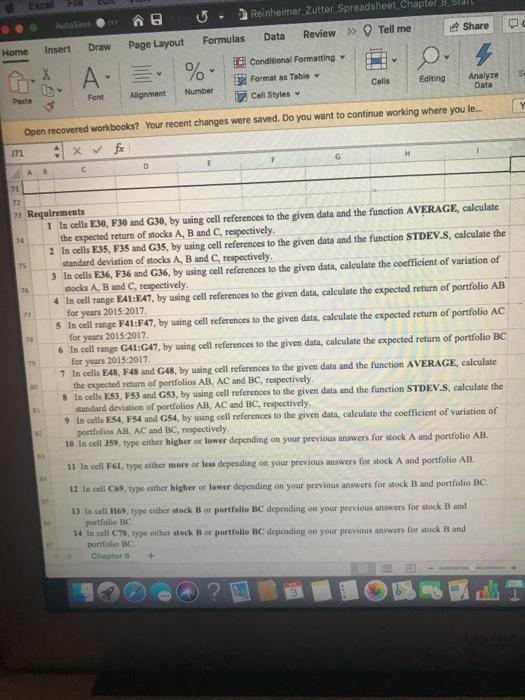
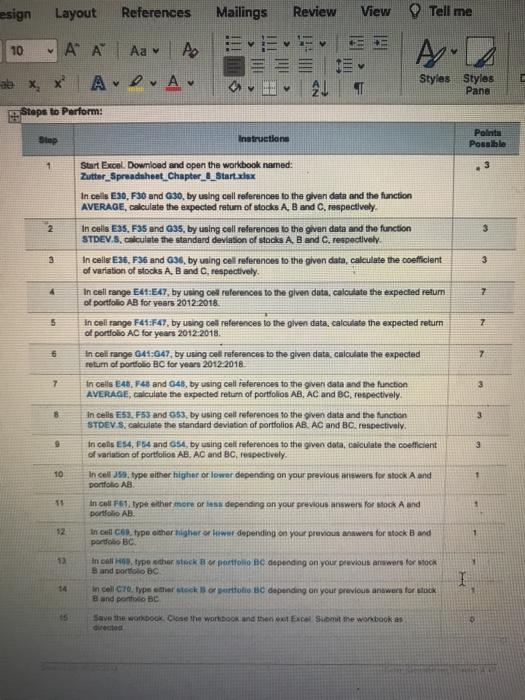
a Share Commer El Fee Edit View Insert Format Tools Data Window Help . Reinheimer Zutter Spreadsheet Chapter 8 Start Home Insert Draw Page Layout Formulas Data Review View Tell me X Conditional Formatting Formats Table Pa Font Alignant Number Cali Editing Cell Styles A. % 0 N Open recovered workbooks? Your recent changes were saved. Do you want to continue working where you left off? Yes Xfx lane is considering investing in three different stocks or creating three distinct twostock portfolios. Jane views c 1 Spreadsheet Exercise: Chapter 8 A Jane is considering investing in three different stocks or creating three distinct Iwostock portfolios. Jane views herself as a rather conservative investor. She is able to obtain historical returns for the three securities for the years 2012 through 2018. The data are even is the following table Year 2012 2013 2014 2015 2016 2017 2018 Stock A 10% 13% 15% 14% 16% 14% 12% Stock B 10% 1194 8% 12% 10% 15% 15% Stock C 12% 14% 10% 1156 94 994 10% 11 In any of the posible two-stock portfolios, the weight of each stock in the portfolio will be 50%. The three possible portfolio combination we AB, AC, and BC To Do Create a spreadsheet milar to Table 86 and 87 to answer the following: . Calculate the average return for each individual stock b. Calculate the standard deviation for each individual dock Calculate the average returns for portfolios AB, AC, and BCE d. Call the standard deviations for portfolios AB, AC, and BC Would you recommend that lune invest in the single stock A ce the portfolio conuiting of stocks A and B xplain your Would you recommend that one invest in the single stock B or the portfolio consisting of stocks and C'Explain your Solution 100 Insent Format Excel File Edit View Tools Data Window Help AutoSavo Reinheimer Zutter Spreadsheet Chapter 8 Start Share Comments Home Insert Draw Page Layout A. % Formulas Data>> Tell me Conditional Formatting Formatas Table Cal 12 Cell Styles 4 Sensitivity Clipboard Font Editing Alignment Number Analyze Data Yes No Open recovered workbooks? Your recent changes were saved. Do you want to continue working where y. 822 C F D e. Would you recommend that June invest in the single stock A or the portfolio consisting of stocks A and B? Explain your answer from a risk-return viewpoint. L Would you recommend that Jane invest in the single stock B or the portfolio consisting of stocks B and C? Explain your answer from a risk-return viewpoint. Solution 20 20 Calculate the average return for each individual stock 20 Stock A Stock Stock C 30 Expected return 30 b. Calculate the standard deviation for each individual stock Stock A Stock B Stock Standard deviation Coefficient of variation 13 c. Calculate the average returns for portfolio AB, AC, and BC Year 2012 Port AB Port AC Port BC 2013 2014 2015 2016 2012 the device for an ARAC 3001 Excel File Edit View insert Format AutoSave . Last Tools Data Window Help Reinheimer Zutter Spreadsheet.Chapter 8 Start Data Tell me Share Home Insert Draw Page Layout Formulas Comments A % 4 Sensity Yes No Conditional Formatting Formatas Table Cipboard Font Alignment Number Calls Editing Analyre Call Styles Data Open recovered workbooks? Your recent changes were saved. Do you want to continue working where y.. 322 x fx 1 D 2015 2016 2017 2018 Expected return 1 A 44 d. Calculate the standard deviations for portfolios AB, AC, and BC. Port AB Port. AC Port BC 31 Standard deviation Coefficient of variation Would you recommend that Jane invest in the single stock A or the portfolio consisting of stocks A and B? Explain your answer from a risk-return Viewpoint. 00 Stock A has an expected return of 0.00% with a standard deviation of 0.00% Investing in the portfolio has a standard deviation of 0.00% so there is both a amount of risk and return in the portfolio We can see that the CV of the portfolio is than that of stock A alone, so the portfolio of AB should be recommended 1. Would you recommend that lane invest in the single stock B or the portfolio consisting of socks Band C? Explain your anver from a risk return viewpoint IE Stock Blus an expected return of 0.00% with a standard deviation of 0.00% Investing in the portfolio comprised of stocks li and delivers a return of 0.00% and is sociated with a standard deviation of 0.00% So both the return and risk of the portfobo are Considering die CV, however, June, can determine that preferable to becibe CV is low 1001 DO Auto Reinheimer Zutter Spreadsheet Chapter B.Su Insert Draw Home Page Layout Formulas Data Review >> Tell me Share X % Conditional Formatting Formatas Table Font Alignment Number Calls Editing Analyze Call Styles Data Open recovered workbooks? Your recent changes were saved. Do you want to continue working where you le... 71 ex fe A D A 5 C 31 31 12 7 Requirements 1 In cells E30, F30 and G30, by using cell references to the given data and the function AVERAGE, calculate the expected return of stocks A, B and respectively, 2 In cells E35, F35 and G35, by using cell references to the given data and the function STDEV.S, calculate the standard deviation of stocks A, B and C, respectively. 3 In cells E36, F36 and G36, by using cell references to the given data, calculate the coefficient of variation of stocks A, B and C, respectively. 4 In cell range F41:147, by using cell references to the given data, calculate the expected return of portfolio AB for years 2015-2017 5 In cell range F41:F47, by using cell references to the given data, calculate the expected return of portfolio AC for years 2015-2017 6 In cell range G41:G47, by using cell references to the given data, calculate the expected return of portfolio BC for years 2015-2017 7 In cells E48, F48 and G48, by using cell references to the given data and the function AVERAGE, calculate the expected return of portfolios AB, AC and BC, respectively In cells 53, F33 and G53, by using cell references to the given data and the function STDEV.S, calculate the standard deviation of portfolios AB, AC and BC, respectively 9 In cells ES4, F54 und G54, by using cell references to the given data, calculate the coefficient of variation of portfolios AB, C and BC, respectively 10 In cell 359, type either higher or lower depending on your previous answers for stock A and portfolio AB. 11 In cell F61, type sither more or less depending on your previous answers for stock A and portfolio AB 12 In cell C69, type the higher or lower depending on your previous awwers for stock Band portfolio BC 13 In cell 09 type either stock or portfolio BC depending on your previous answers for stock Band portfolio 14 In cell C70, type either stock Bor portfolio BC depending on your previous answers for stock Band portfolio Isc Chapter esign Layout References Mailings Review View Tell me 10 ' ' X X Ave . A. ale 5 E 21 T Styles Styles Pane Steps to Perform: lp Instructions Polina Posable 1 3 3 3 4 7 5 Start Excel. Download and open the workbook named: Zutter_Spreadsheet_Chapter_I_Start.xlsx In cells E30, F30 and 630, by using cell references to the given date and the function AVERAGE, calculate the expected retum of stocks A B and C, respectively. In cells E3, F35 and 635, by using cell references to the given data and the function STDEV.S. calculate the standard deviation of stocks A, B and C. respectively. In cells E36, F36 and G36, by using cell references to the given data, calculate the coefficient of variation of stocks A, B and respectively. In cell range E41:E47, by using coil references to the given dute, calculate the expected retum of portfolio AB for years 2012 2018 in cel range F44:F47, by using cell references to the given data, calculate the expected return of portfolio AC for years 2012-2018 In celt range 6413947, by using cell references to the given data, calculate the expected return of portfolio BC for years 2012-2018 In cells E45, 145 and 645, by using cell references to the given data and the function AVERAGE, calculate the expected return of portfolios AB, AC and BC, respectively. In cells E53. F53 and 53, by using colt references to the given data and the function STDEV S. calculate the standard deviation of portfolios AB. AC and BC. respectively. In cells E54, 554 and 454, by using cell references to the given data, calculate the coefficient of variation of portfolios AB AC and Brespectively In cell type other higher or lower depending on your previous answers for stock A and portfolio AB 7 6 7 7 3 9 3 10 1 15 In col type either more or les depending on your previous answers for Nock A and portfolio AB 12 In all type other higher leww depending on your previous awer for stock Band pondo BC 12 1 In call type other stock portfolio ac depending on your previous answers for stock Band Doro Bo I In cell CTO Type other source depending on your previous answers for Sock Band pantsBC Save the book. Close the work and the Excel Submit the workbooks directed
Step by Step Solution
There are 3 Steps involved in it

Get step-by-step solutions from verified subject matter experts