

Question: ........... For each graph, indicate whether the shaded area could represent a p-value. Explain why or why not. If yes, state whether the area could
...........
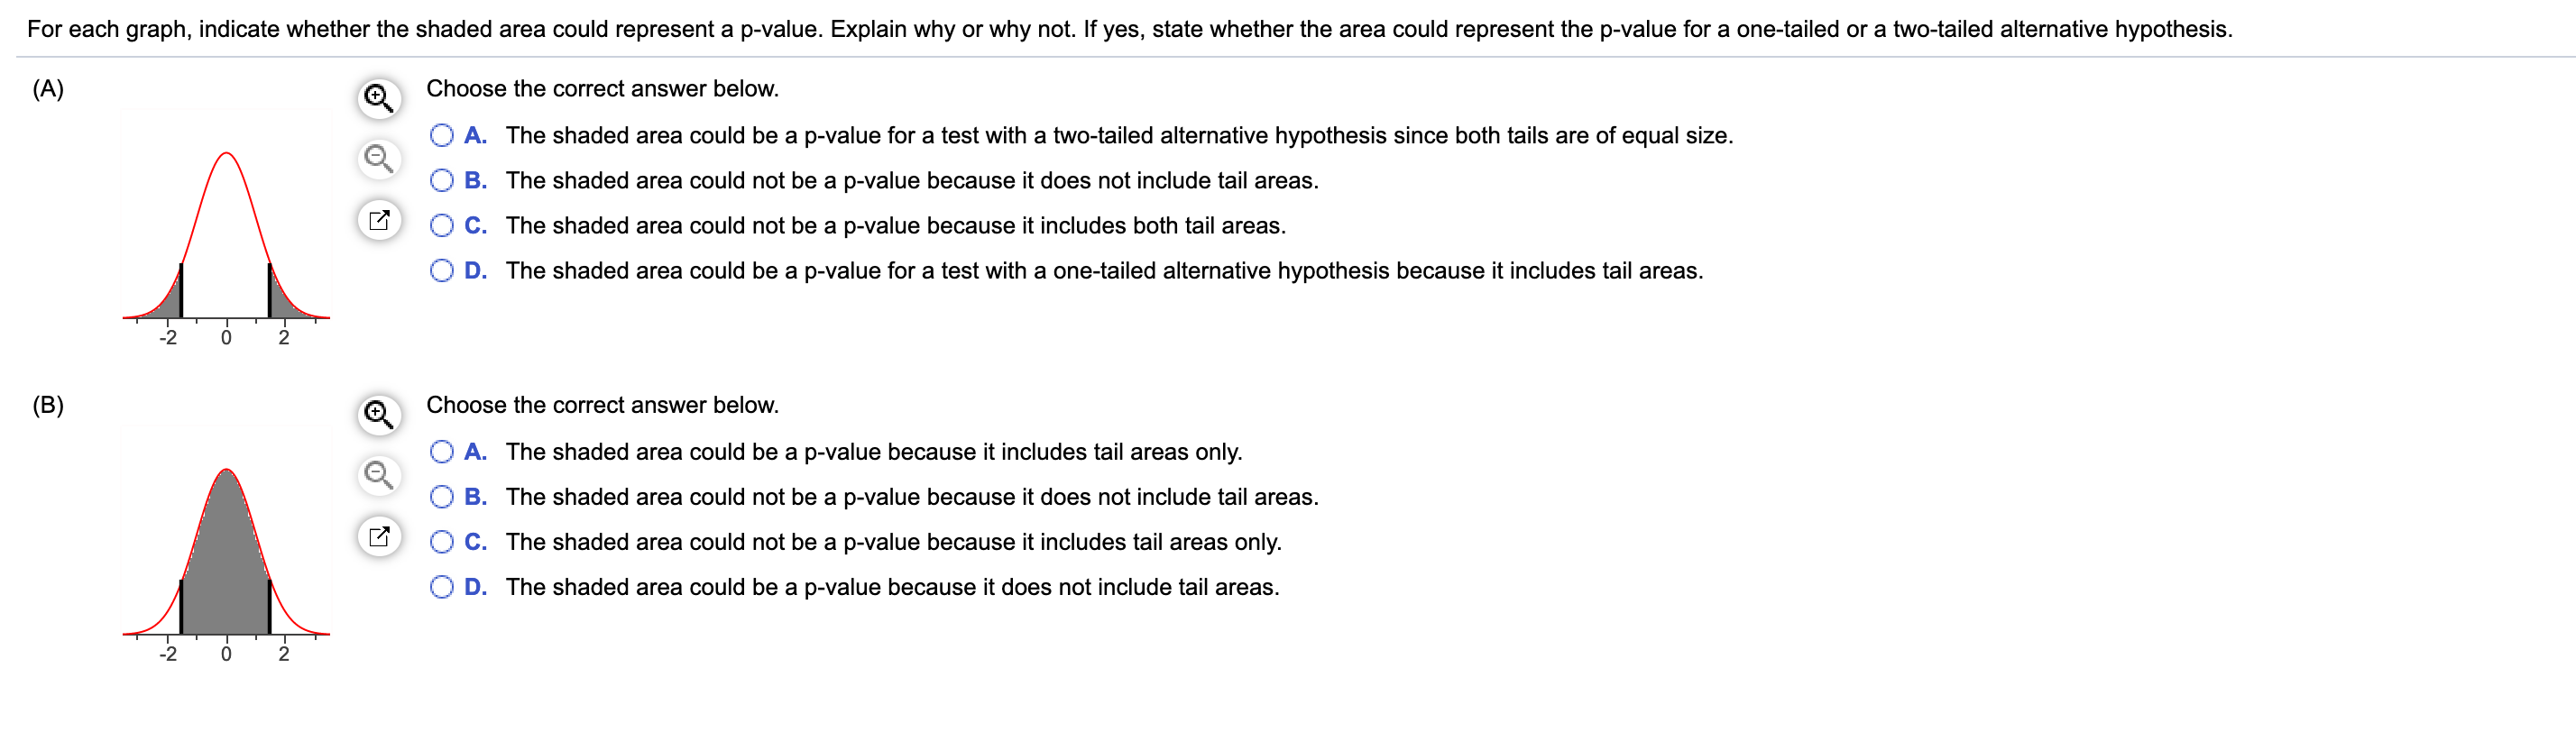
For each graph, indicate whether the shaded area could represent a p-value. Explain why or why not. If yes, state whether the area could represent the p-value for a one-tailed or a two-tailed alternative hypothesis. (A) Q Choose the correct answer below. 0 A. The shaded area could be a p-value for a test with a two-tailed alternative hypothesis since both tails are of equal size. 9' O B. The shaded area could not be a p-value because it does not include tail areas. D\" O c. The shaded area could not be a p-value because it includes both tail areas. O D. The shaded area could be a p-value for a test with a one-tailed alternative hypothesis because it includes tail areas. -2 o 2 (B) Q Choose the correct answer below. O A. The shaded area could be a p-value because it includes tail areas only. 3' O B. The shaded area could not be a p-value because it does not include tail areas. 3 O c. The shaded area could not be a p-value because it includes tail areas only. 0 D. The shaded area could be a p-value because it does not include tail areas
Step by Step Solution
There are 3 Steps involved in it

Get step-by-step solutions from verified subject matter experts