

Question: For each listed point, use the preceding graph to complete the following table by indicating the hourly wage as well as the number of hours
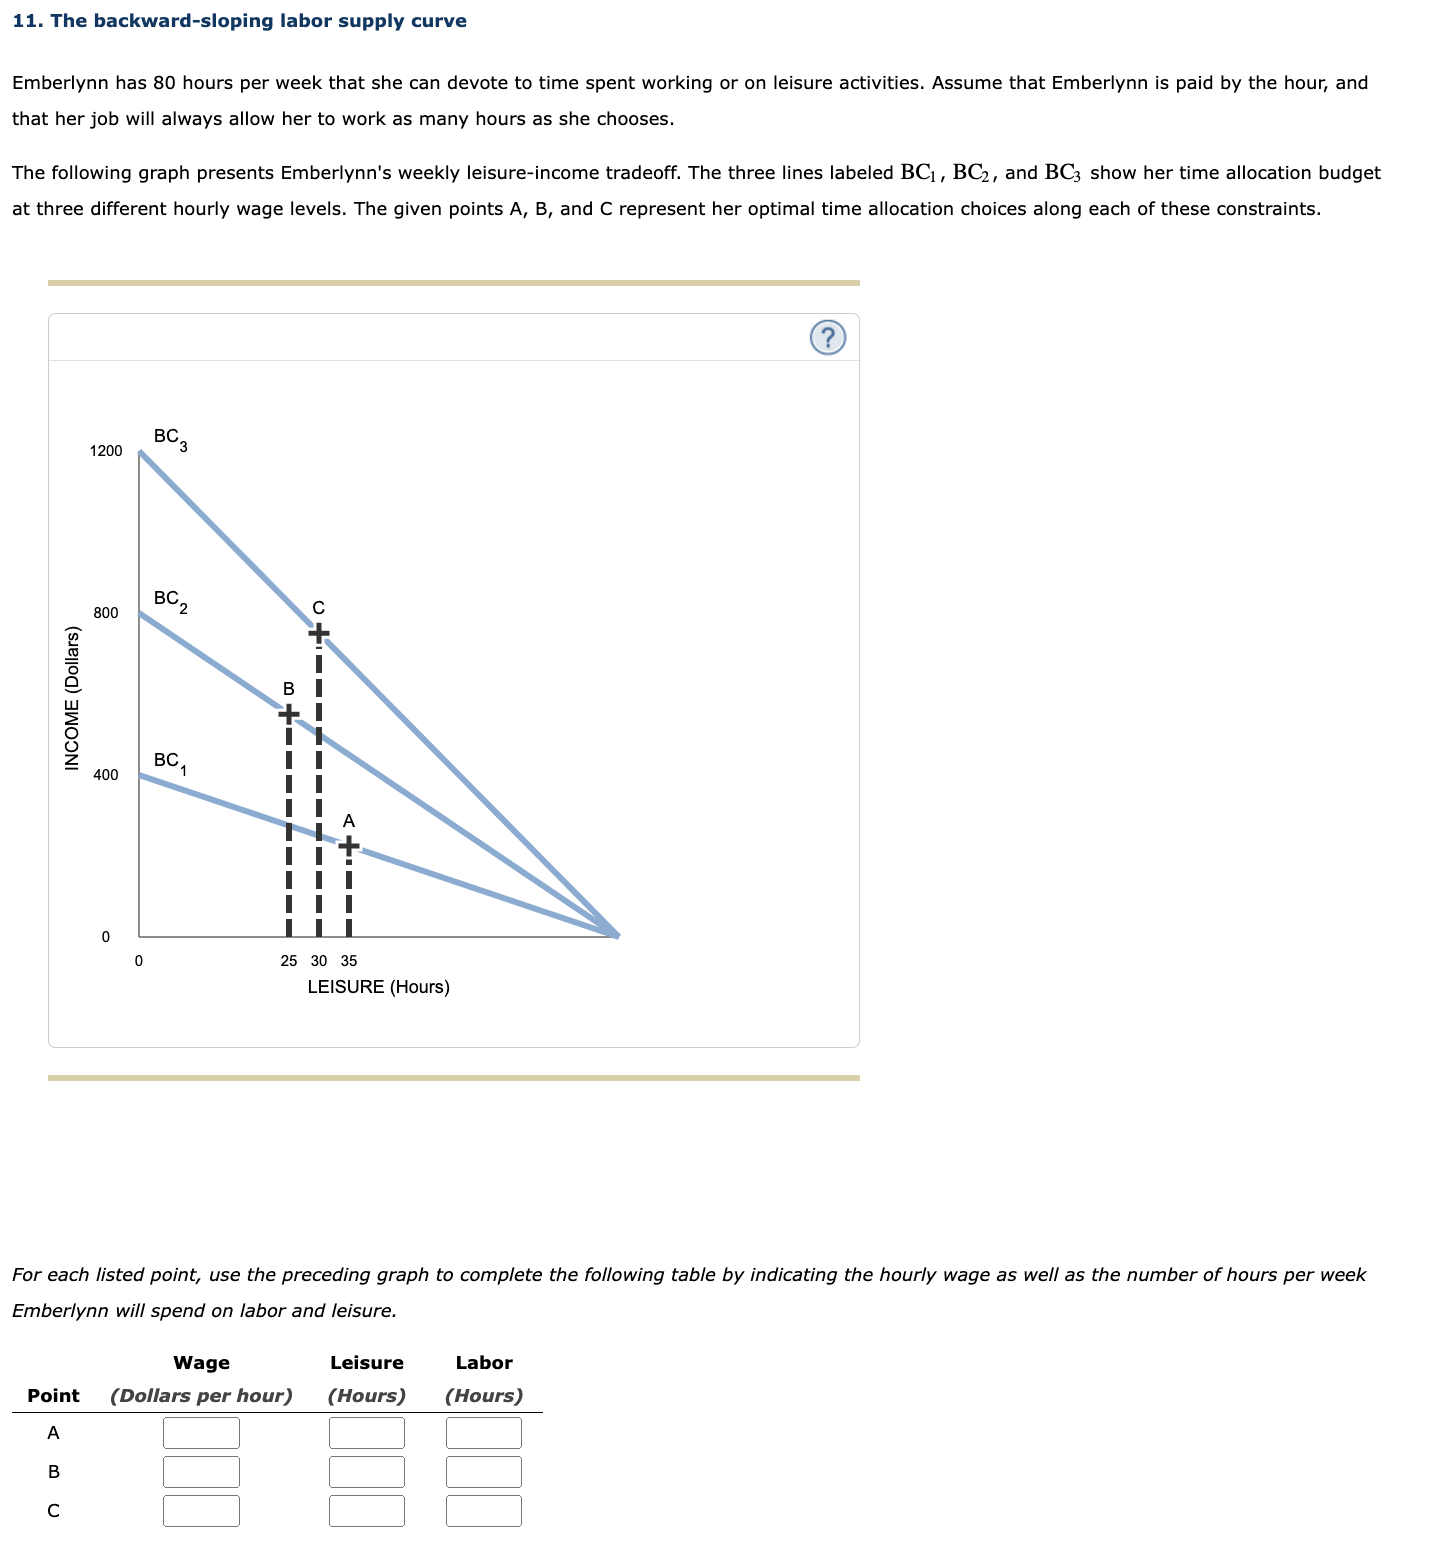
For each listed point, use the preceding graph to complete the following table by indicating the hourly wage as well as the number of hours per week Emberlynn will spend on labor and leisure. Based on the data you entered in the preceding table, use the orange curve square symbols to plot Emberlynn's labor supply curve on the following graph, showing how much labor she supplies each week at each of the three wages.
Suppose that Emberlynn's initial budget line was mathrmBC and that it then changed to mathrmBC; therefore, Emberlynn's optimal time allocation choice shifted from B to C As a result of this change, Emberlynn's opportunity cost of leisure and she chose to consume leisure. Consequently, in this region, the effect dominates the effect. The corresponding portion of Emberlynn's labor supply curve is
Step by Step Solution
There are 3 Steps involved in it
1 Expert Approved Answer
Step: 1 Unlock

Question Has Been Solved by an Expert!
Get step-by-step solutions from verified subject matter experts
Step: 2 Unlock
Step: 3 Unlock