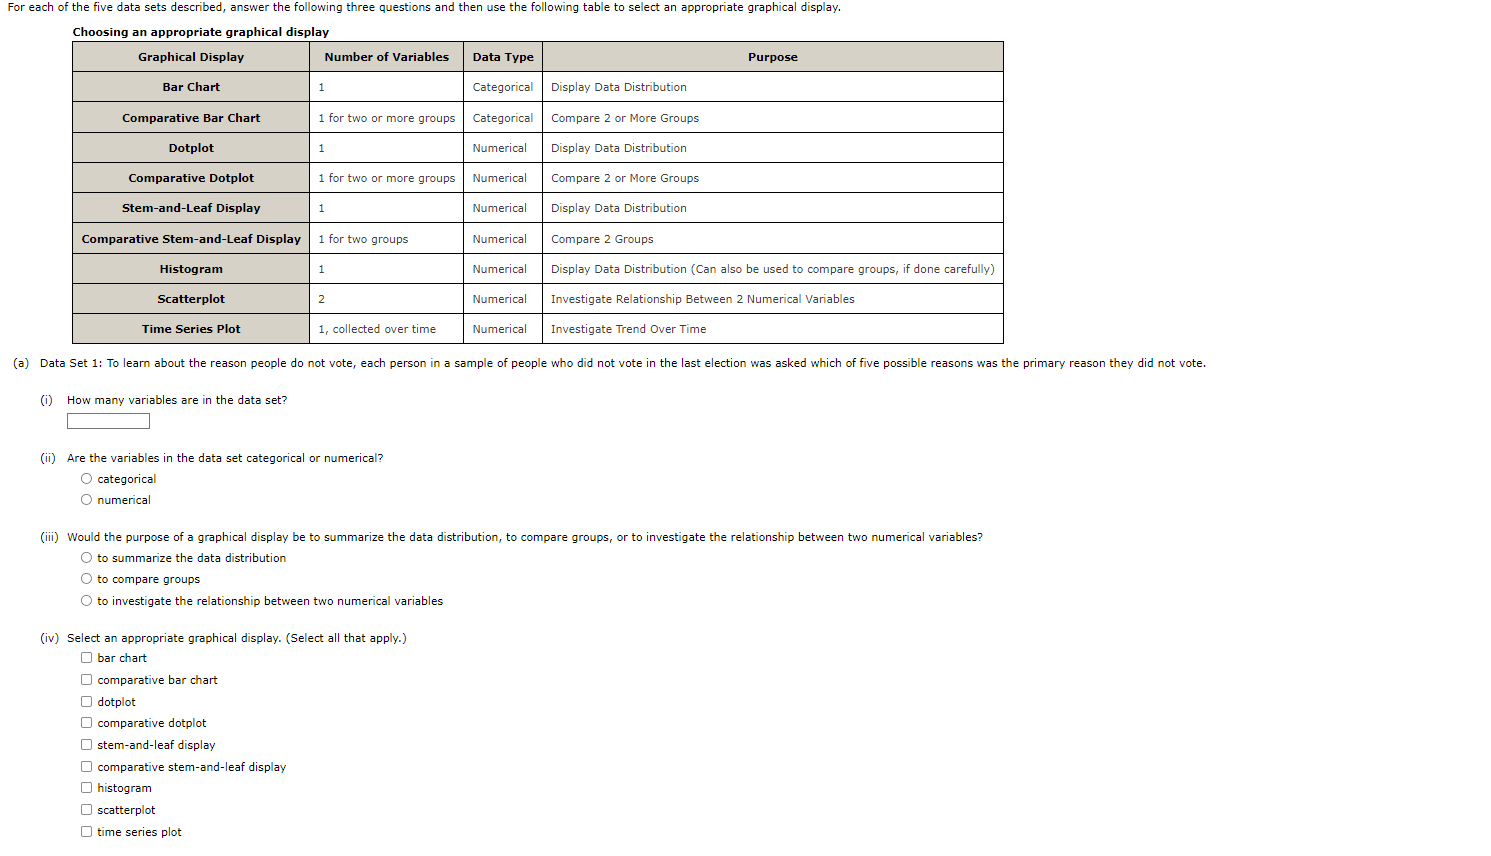
Question: For each of the five data sets described, answer the following three questions and then use the following table to select an appropriate graphical display.
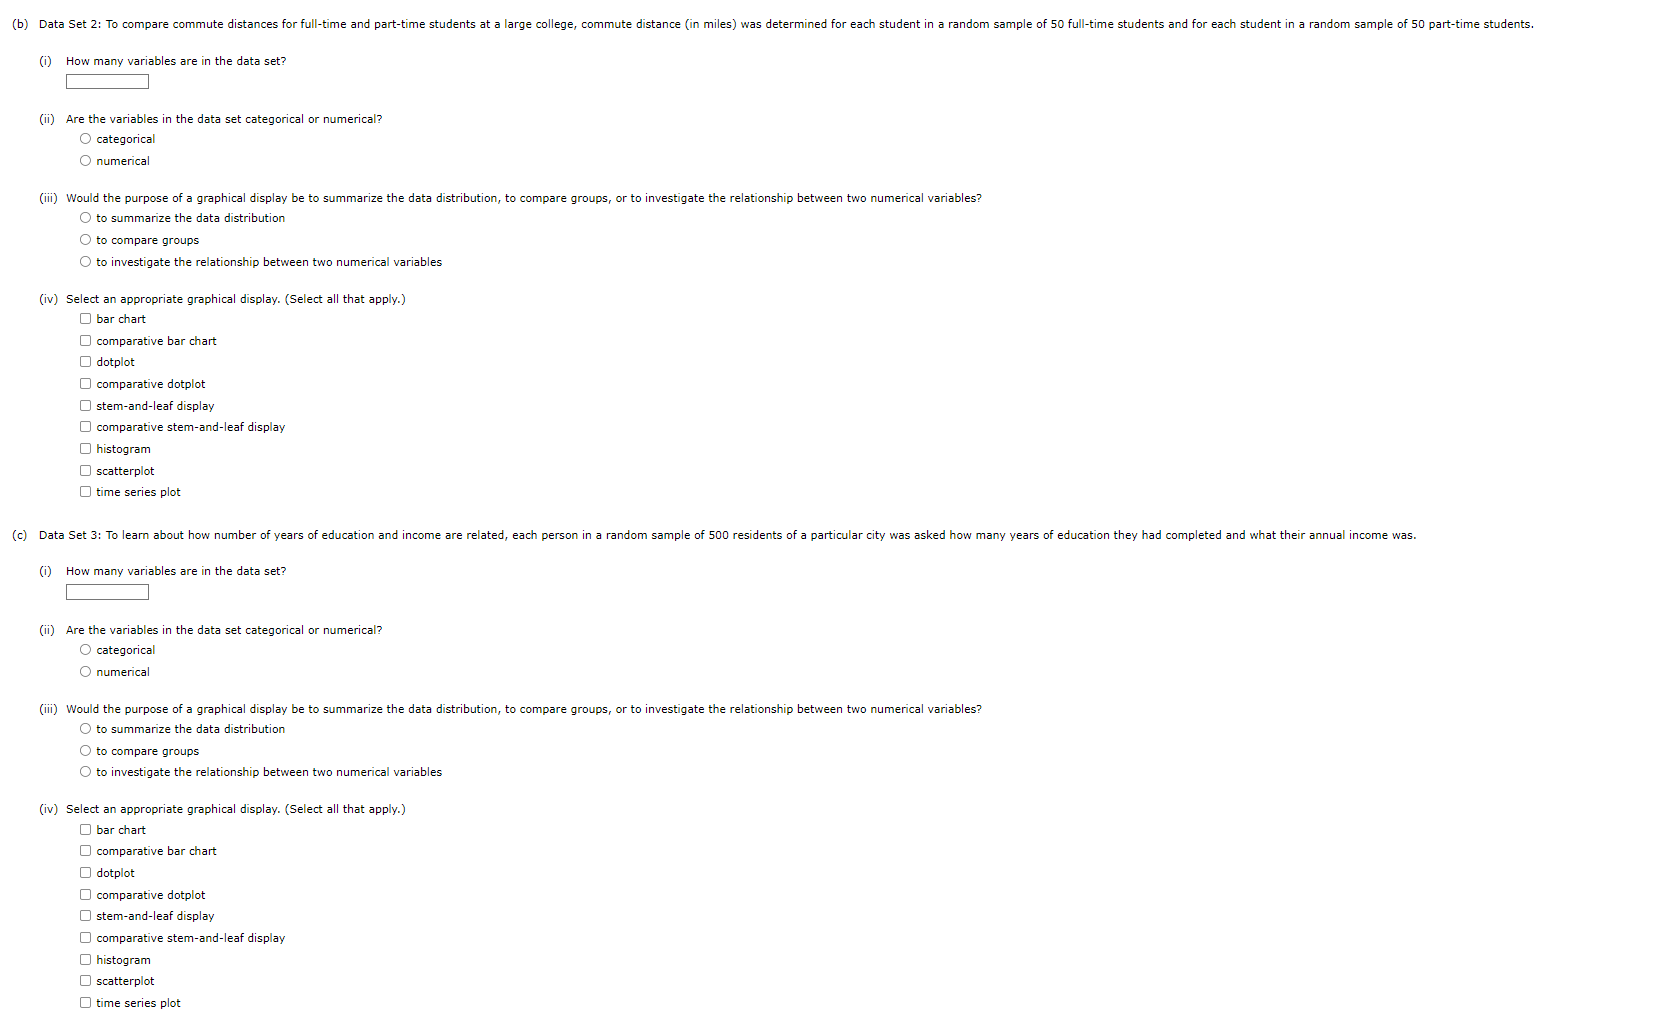
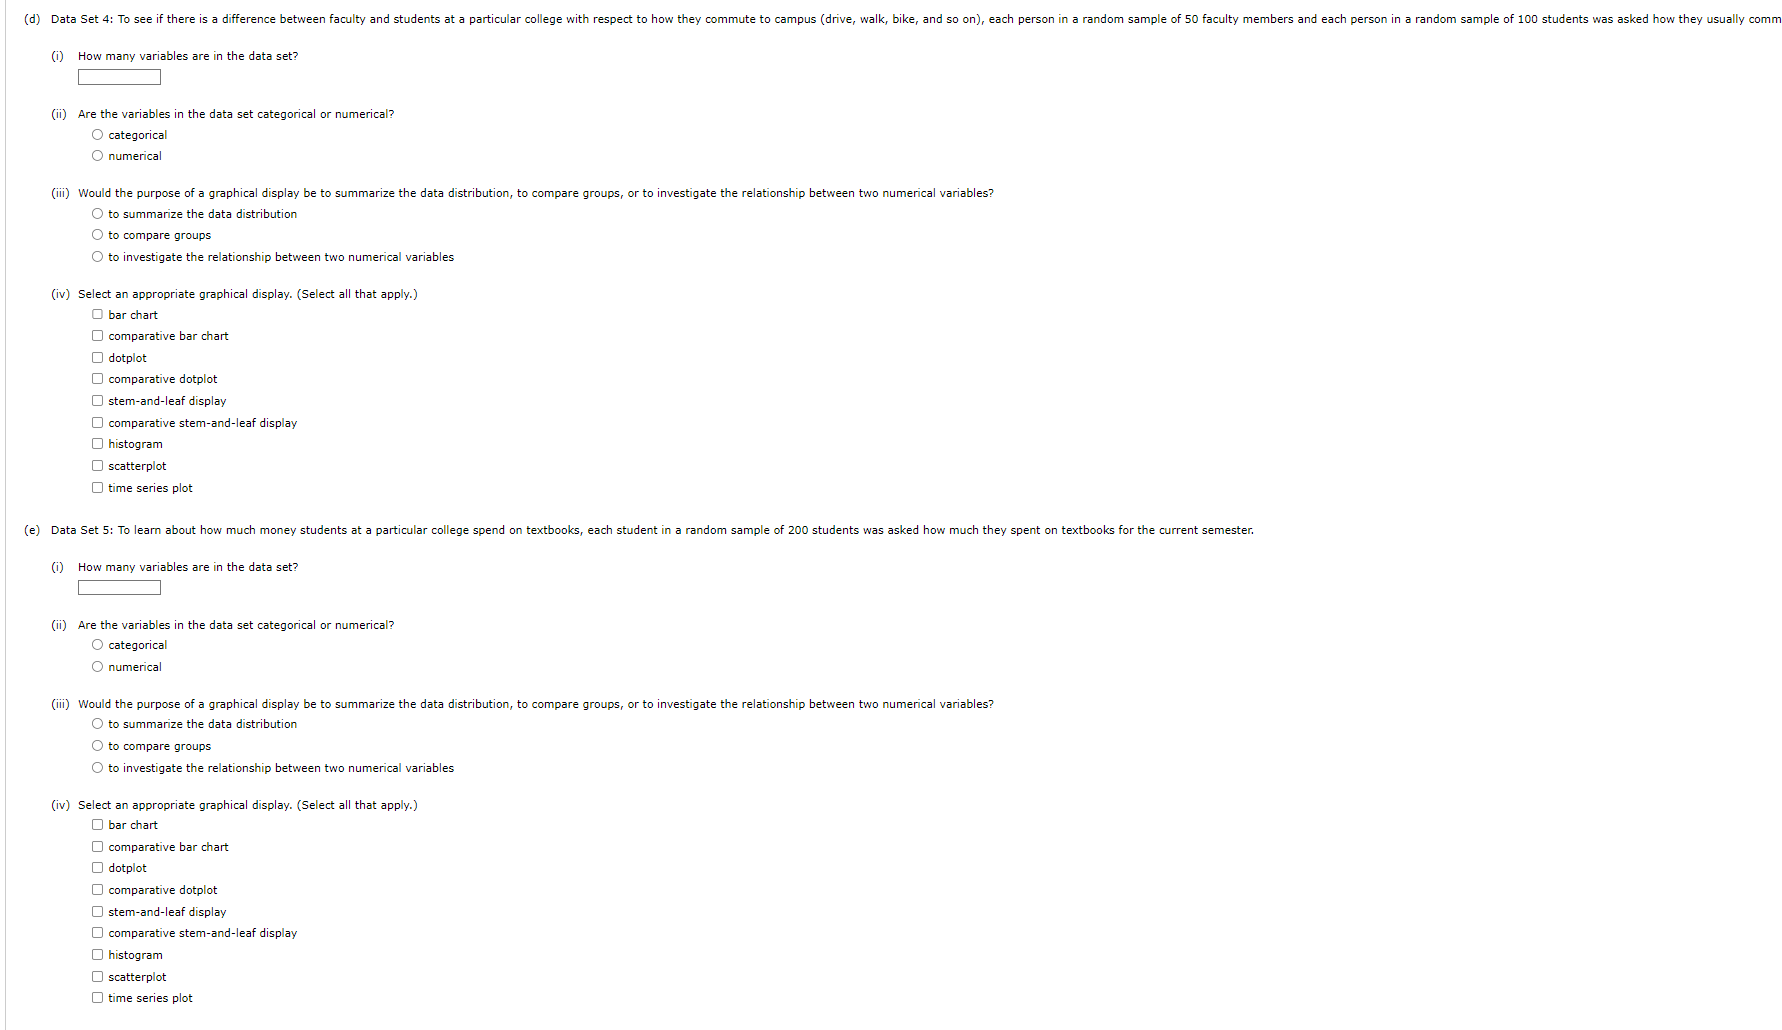
For each of the five data sets described, answer the following three questions and then use the following table to select an appropriate graphical display. Choosing an appropriate graphical display Graphical Display Number of Variables | Data Type Purpose Bar Chart 1 Categorical | Display Data Distribution Comparative Bar Chart 1 for twe or more groups | Categorical | Compare 2 or More Groups Dotplot 1 Numerical Display Data Distribution Comparative Dotplot 1 for two or more groups | Mumerical | Compare 2 or More Groups Stem-and-Leaf Display 1 Numerical Display Data Distribution Comparative Stem-and-Leaf Display | 1 for twe groups Numerical Compare 2 Groups Histogram 1 Numerical Display Data Distribution (Can also be used to compare groups, if done carefully) Scatterplot 2 Mumerical | Investigate Relationship Between 2 Numerical Variables Time Series Plot 1, collected over time Numerical Investigate Trend Over Time (a) Data Set 1: To learn about the reason people do not vote, each person in a sample of people who did not vote in the last election was asked which of five possible reasons was the primary reason they did not vote. (i) How many variables are in the data set? (ii) Are the variables in the data set categorical or numerical? O categorical numerical (iii) Would the purpose of a graphical display be to summarize the data distribution, to compare groups, or to investigate the relationship between two numerical variables? to summarize the data distribution O to compare groups O to investigate the relationship between two numerical variables {iv) Select an appropricte graphical display. (Select all that apply.) [ bar chart [l comparative bar chart dotplat ) comparative dotplet [ stem-and-leaf display [ comparative stem-and-leaf display [T histagram [ scatterplot [ time series plot (b} Data Set 2: Te compare commute distances for full-time and part-time students at a large college, commute distance (in miles) was determined for each student in @ random sample of 50 full-time students and for each student in a random sample of 50 part-time students, (i) How many variables are in the data set? (i) Are the varigbles in the data set categorical or numerical? categorical numerical (iii) Would the purpose of a graphical display be to summarize the data distribution, to compare groups, or to investigate the relationship between two numerical variables? to summarize the data distribution to compare groups to investigate the relationship between two numerical variables (iv) Select an appropriate graphical display. (Select all that apply.) [ bar chart ) comparative bar chart [ dotplot [J comparative dotplot [ stem-and-leaf display ) comparative stem-and-leaf display [ histogram [ scatterplot time series plot (c) Data Set 3: To learn about how number of years of education and income are related, each person in a randem sample of 500 residents of a particular city was asked how many years of education they had completed and what their annual income was. (i) How many variables are in the data set? (i) Are the variables in the data set categorical or numerical? eategorical numerical (iii) Would the purpose of a graphical display be to summarize the data distribution, to compare groups, or to investigate the relationship between two numerical variables? to summarize the data distribution to compare groups to investigate the relationship between two numericsl variables (iv) Select an appropriate graphical display. (Select all that apply.) [ bar chart [ comparative bar chart [ dotplot [J comparative dotplot [ stem-and-leaf display ) comparative stem-and-leaf display [ histogram ) scatterplot time series plot (d) Data Set 4: To see if there is a difference between faculty and students at a particular college with respect to how they commute to campus (drive, walk, bike, and so on), each person in a random sample of 50 faculty members and each person in random sample of 100 students was asked how they usually comm (i) How many variables are in the data set? (i} Are the variables in the data set categorical or numerical? categorical numerical (il} Would the purpose of a graphical display be to summarize the data distribution, to compare groups, or to investigate the relationship between two numerical variables? o summarize the data distribution to compare groups O to investigate the relationship between two numerical variables (iv) Select an apprapriate graphical display. (Select all that apply.) O bar chart [J comparative bar chart O dotplot [ comparative dotplot [ stem-and-leaf display [J comparative stem-and-leaf display [ histogram [ scatterplot O time series plot (e) Data Set 5: To learn about how much money students at a particuler callege spend on textboaks, each student in & random sample of 200 students was asked how much they spent on textbooks for the current semester. (i) How many variables are in the data set? (i) Are the variables in the data set categorical or numerical? categorical numerical (ii}) Would the purpose of a graphical display be to summarize the data distribution, to compare groups, or to investigate the relationship between two numerical variables? to summarize the data distribution O to compare groups to investigate the relationship bebween two numerical variables (iv) Select an appropriate graphical display. (Select all that apply.) [ bar chart [ comparative bar chart O dotplot [J comparative dotplot [ stem-and-leaf display [J comparative stem-and-leaf display O histogram [ scatterplot O time series plot
Step by Step Solution
There are 3 Steps involved in it
1 Expert Approved Answer
Step: 1 Unlock
Question Has Been Solved by an Expert!
Get step-by-step solutions from verified subject matter experts
Step: 2 Unlock
Step: 3 Unlock
Students Have Also Explored These Related Mathematics Questions!